


Through April of this year, the national average increase in construction cost was 4.48%, annualized. Construction put in place during April 2019, at a seasonally adjusted annualized rate of $1.299 trillion, was 1.2% below construction put in place in April 2018.
In its just-released second quarter Construction Cost Report for North America, which is based on data from a dozen U.S. markets ansdn two Canadian markets, the construction management consultant Rider Levett Bucknall reiterates the financial and time impacts that the shortage of qualified trade workers is having on the construction industry’s productivity and expansion.
“Even as technology transforms the jobsite, improving both efficiency and worker safety, skilled-labor recruitment and retention are essential to the future of construction,” writes Julian Anderson, FRICS, Rider Levett Bucknall’s President-North America. “As worker shortage makes projects more costly and slower to build, the risk of undermining broader economic growth increases.”
RLB’s National Construction Cost Index stood at 200.55 in the second quarter of 2019, up from 189.8 in the same quarter a year earlier, and 182.16 in Q2 2017. Keep in mind that these increases are occurring at a time when there has been relatively little inflation in the economy.

The construction backlog in North America was more than nine months in the second quarter. Image: Rider Levett Bucknall, from Associated Builders and Contractors estimates.
RLB's estimates are in line Turner Construction's quarterly Building Cost Index (https://bit.ly/2xWrf61), which the GC giant released on July 16. That Index, at 1149, was up 1.23% over the first quarter, and 5.51% over the second quarter of 2018. “Contractors continue to be selective due to the availability of skilled labor,” wrote Attilio Rivetti, Turner's vice president responsible for compiling its cost index.
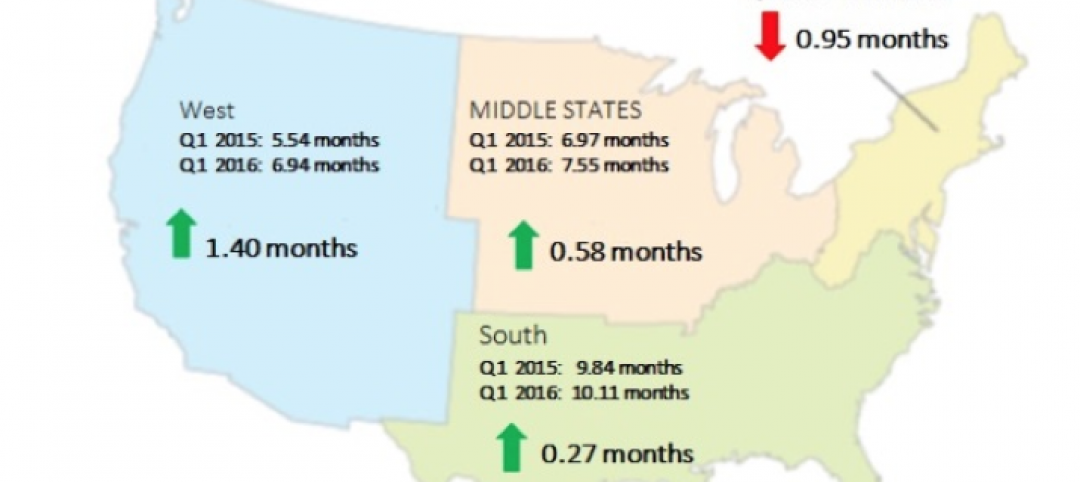
To further make its case, RLB cites the Associated Builders and Contractors’ Construction Backlog Indicator, which reflects the amount of work that will be performed by commercial and industrial contractors in the months ahead. The backlog for 2018 averaged 9.15 months, slightly below the 2017 average but still up 17% from 2011.
The report breaks down current building costs by market and by seven typologies: offices, retail, hotels, hospitals, warehouses, parking, and residential. For example, Las Vegas, Phoenix, Portland, Seattle, and Denver continue to be relative bargains for office construction, based on their costs per sf. Los Angeles, Washington DC, and New York are the high-priced spreads when building hospitals. As for hotel construction, Honolulu and San Francisco are priciest.
Overall, Chicago experienced the greatest increase in construction bid costs (including materials, labor, and fees), 8.77%, between April 2018 and April 2019, followed San Francisco (7.05%), Portland (6.82%), Seattle (6.68%), Phoenix (6.47%), and Honolulu (5.83%), all above the national average increase.
Los Angeles, while no slouch on the construction front, was the only metro that RLB tracks that experienced a decrease in construction costs in the second quarter, down 1.22%.

Chicago experienced the highest percentage increase in quarterly construction costs. Image: Rider Levett Bucknall
Through the first quarter of 2019, construction unemployment remained steady at 5.2%. The vast majority of construction firms are still having trouble filling open positions. And this situation could worsen, according to the Associated General Contractors of America, as a result of the Trump Administration’s proposal, announced last month, which would exclude the construction sector from the Labor Department’s apprenticeship framework. (Currently, more than three quarters of the federally administered apprenticeships in the U.S. are either in construction or part of military training, notes RLB.)
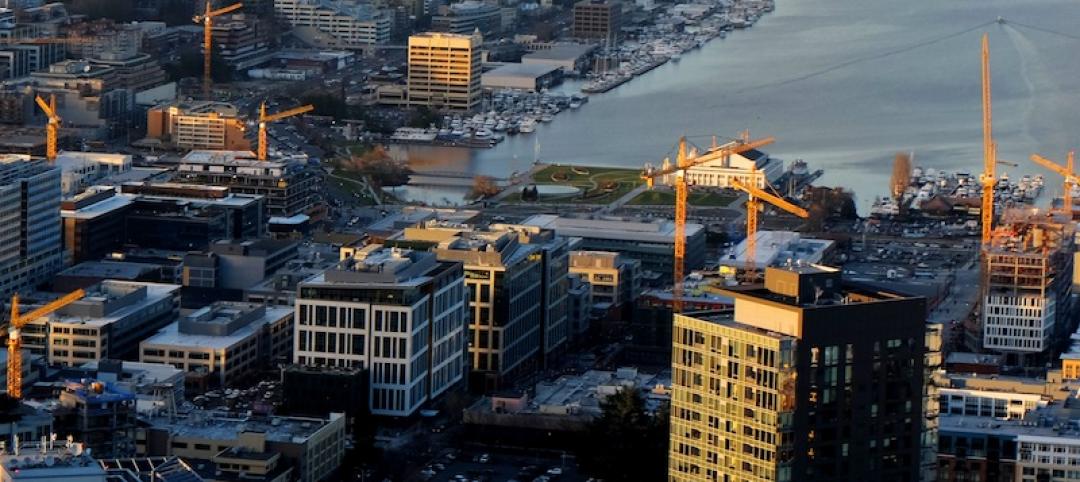
In a separate report that gauges construction activity by the number of cranes in use in North America, RLB’s July survey marked the fourth consecutive increase. However, only two of 11 U.S. markets tracked—Los Angeles and Denver—saw an increase in cranes. Five other cities were steady.
Cranes for commercial projects were up nationally and accounted for 41% of the cranes in use in New York City. In all markets, mixed-use and multifamily residential construction accounted for 67% of the cranes counted. In Seattle alone, mixed use and residential required 78% of cranes used.
Related Stories
Multifamily Housing | Aug 12, 2016
Apartment completions in largest metros on pace to increase by 50% in 2016
Texas is leading this multifamily construction boom, according to latest RENTCafé estimates.
Market Data | Jul 29, 2016
ABC: Output expands, but nonresidential fixed investment falters
Nonresidential fixed investment fell for a third consecutive quarter, as indicated by Bureau of Economic Analysis data.
Industry Research | Jul 26, 2016
AIA consensus forecast sees construction spending on rise through next year
But several factors could make the industry downshift.

Architects | Jul 20, 2016
AIA: Architecture Billings Index remains on solid footing
The June ABI score was down from May, but the figure was positive for the fifth consecutive month.

Market Data | Jul 7, 2016
Airbnb alleged to worsen housing crunch in New York City
Allegedly removing thousands of housing units from market, driving up rents.

Market Data | Jul 6, 2016
Construction spending falls 0.8% from April to May
The private and public sectors have a combined estimated seasonally adjusted annual rate of $1.14 trillion.
Market Data | Jul 6, 2016
A thriving economy and influx of businesses spur construction in downtown Seattle
Development investment is twice what it was five years ago.

Multifamily Housing | Jul 5, 2016
Apartments continue to shrink, rents continue to rise
Latest survey by RENTCafé tracks size changes in 95 metros.
Multifamily Housing | Jun 22, 2016
Can multifamily construction keep up with projected demand?
The Joint Center for Housing Studies’ latest disection of America’s housing market finds moderate- and low-priced rentals in short supply.
Contractors | Jun 21, 2016
Bigness counts when it comes to construction backlogs
Large companies that can attract talent are better able to commit to more work, according to a national trade group for builders and contractors.


