


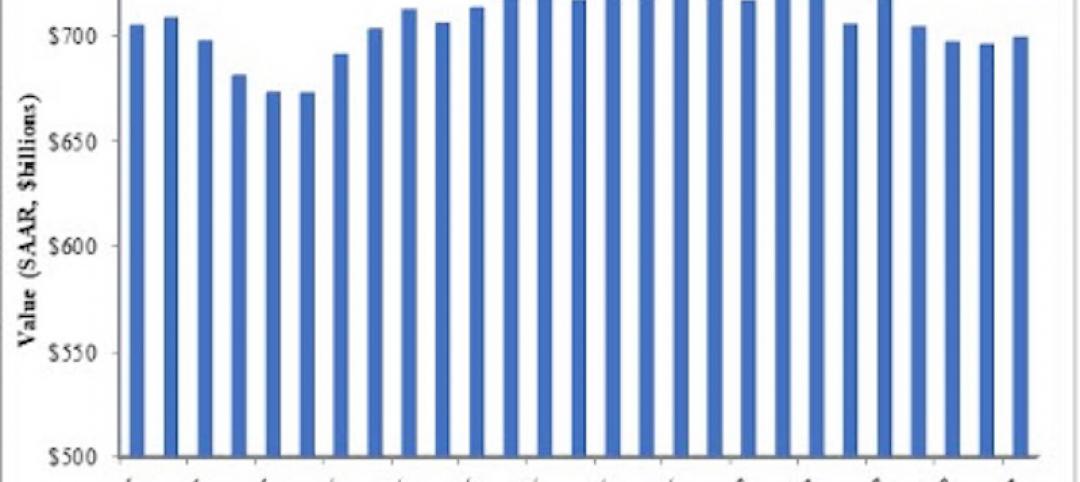
Through April of this year, the national average increase in construction cost was 4.48%, annualized. Construction put in place during April 2019, at a seasonally adjusted annualized rate of $1.299 trillion, was 1.2% below construction put in place in April 2018.
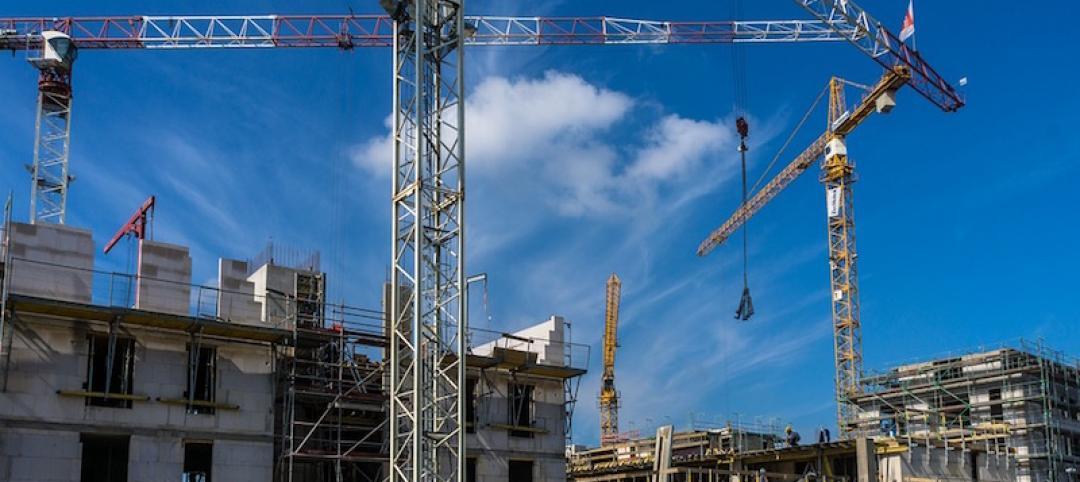
In its just-released second quarter Construction Cost Report for North America, which is based on data from a dozen U.S. markets ansdn two Canadian markets, the construction management consultant Rider Levett Bucknall reiterates the financial and time impacts that the shortage of qualified trade workers is having on the construction industry’s productivity and expansion.
“Even as technology transforms the jobsite, improving both efficiency and worker safety, skilled-labor recruitment and retention are essential to the future of construction,” writes Julian Anderson, FRICS, Rider Levett Bucknall’s President-North America. “As worker shortage makes projects more costly and slower to build, the risk of undermining broader economic growth increases.”
RLB’s National Construction Cost Index stood at 200.55 in the second quarter of 2019, up from 189.8 in the same quarter a year earlier, and 182.16 in Q2 2017. Keep in mind that these increases are occurring at a time when there has been relatively little inflation in the economy.

The construction backlog in North America was more than nine months in the second quarter. Image: Rider Levett Bucknall, from Associated Builders and Contractors estimates.
RLB's estimates are in line Turner Construction's quarterly Building Cost Index (https://bit.ly/2xWrf61), which the GC giant released on July 16. That Index, at 1149, was up 1.23% over the first quarter, and 5.51% over the second quarter of 2018. “Contractors continue to be selective due to the availability of skilled labor,” wrote Attilio Rivetti, Turner's vice president responsible for compiling its cost index.
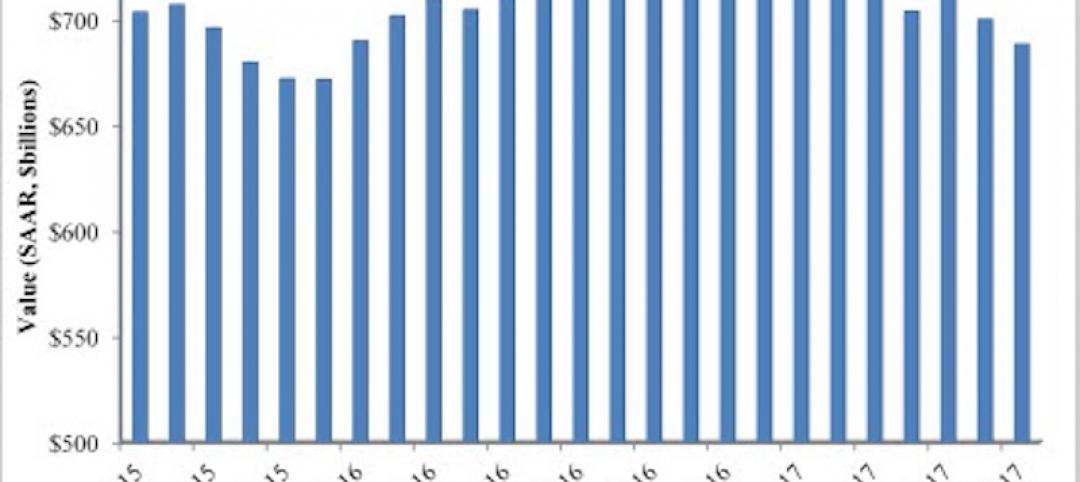
To further make its case, RLB cites the Associated Builders and Contractors’ Construction Backlog Indicator, which reflects the amount of work that will be performed by commercial and industrial contractors in the months ahead. The backlog for 2018 averaged 9.15 months, slightly below the 2017 average but still up 17% from 2011.
The report breaks down current building costs by market and by seven typologies: offices, retail, hotels, hospitals, warehouses, parking, and residential. For example, Las Vegas, Phoenix, Portland, Seattle, and Denver continue to be relative bargains for office construction, based on their costs per sf. Los Angeles, Washington DC, and New York are the high-priced spreads when building hospitals. As for hotel construction, Honolulu and San Francisco are priciest.
Overall, Chicago experienced the greatest increase in construction bid costs (including materials, labor, and fees), 8.77%, between April 2018 and April 2019, followed San Francisco (7.05%), Portland (6.82%), Seattle (6.68%), Phoenix (6.47%), and Honolulu (5.83%), all above the national average increase.
Los Angeles, while no slouch on the construction front, was the only metro that RLB tracks that experienced a decrease in construction costs in the second quarter, down 1.22%.

Chicago experienced the highest percentage increase in quarterly construction costs. Image: Rider Levett Bucknall
Through the first quarter of 2019, construction unemployment remained steady at 5.2%. The vast majority of construction firms are still having trouble filling open positions. And this situation could worsen, according to the Associated General Contractors of America, as a result of the Trump Administration’s proposal, announced last month, which would exclude the construction sector from the Labor Department’s apprenticeship framework. (Currently, more than three quarters of the federally administered apprenticeships in the U.S. are either in construction or part of military training, notes RLB.)
In a separate report that gauges construction activity by the number of cranes in use in North America, RLB’s July survey marked the fourth consecutive increase. However, only two of 11 U.S. markets tracked—Los Angeles and Denver—saw an increase in cranes. Five other cities were steady.
Cranes for commercial projects were up nationally and accounted for 41% of the cranes in use in New York City. In all markets, mixed-use and multifamily residential construction accounted for 67% of the cranes counted. In Seattle alone, mixed use and residential required 78% of cranes used.
Related Stories
Market Data | Nov 2, 2017
Construction spending up in September; Down on a YOY basis
Nonresidential construction spending is down 2.9% on a year-over-year basis.
Market Data | Oct 19, 2017
Architecture Billings Index backslides slightly
Business conditions easing in the West.

Industry Research | Oct 3, 2017
Nonresidential construction spending stabilizes in August
Spending on nonresidential construction services is still down on a YOY basis.

Market Data | Sep 21, 2017
Architecture Billings Index continues growth streak
Design services remain in high demand across all regions and in all major sectors.

Market Data | Sep 21, 2017
How brand research delivers competitive advantage
Brand research is a process that firms can use to measure their reputation and visibility in the marketplace.

Contractors | Sep 19, 2017
Commercial Construction Index finds high optimism in U.S. commercial construction industry
Hurricane recovery efforts expected to heighten concerns about labor scarcities in the south, where two-thirds of contractors already face worker shortages.
Multifamily Housing | Sep 15, 2017
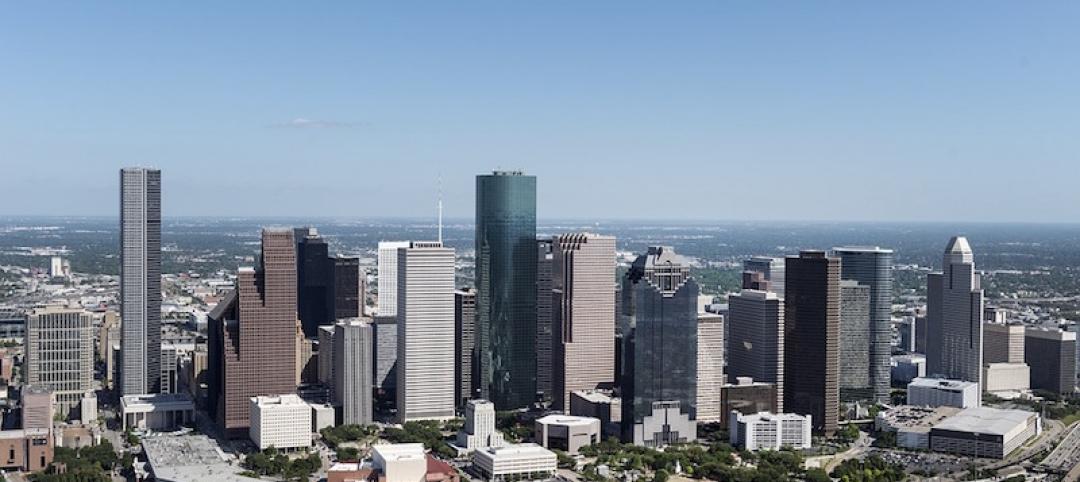
Hurricane Harvey damaged fewer apartments in greater Houston than estimated
As of Sept. 14, 166 properties reported damage to 8,956 units, about 1.4% of the total supply of apartments, according to ApartmentData.com.
Hotel Facilities | Sep 6, 2017
Marriott has the largest construction pipeline of any franchise company in the U.S.
Marriott has the most rooms currently under construction with 482 Projects/67,434 Rooms.
Market Data | Sep 5, 2017
Nonresidential construction declines again, public and private sector down in July
Weakness in spending was widespread.
Market Data | Aug 29, 2017
Hidden opportunities emerge from construction industry challenges
JLL’s latest construction report shows stability ahead with tech and innovation leading the way.


