


Through April of this year, the national average increase in construction cost was 4.48%, annualized. Construction put in place during April 2019, at a seasonally adjusted annualized rate of $1.299 trillion, was 1.2% below construction put in place in April 2018.
In its just-released second quarter Construction Cost Report for North America, which is based on data from a dozen U.S. markets ansdn two Canadian markets, the construction management consultant Rider Levett Bucknall reiterates the financial and time impacts that the shortage of qualified trade workers is having on the construction industry’s productivity and expansion.
“Even as technology transforms the jobsite, improving both efficiency and worker safety, skilled-labor recruitment and retention are essential to the future of construction,” writes Julian Anderson, FRICS, Rider Levett Bucknall’s President-North America. “As worker shortage makes projects more costly and slower to build, the risk of undermining broader economic growth increases.”
RLB’s National Construction Cost Index stood at 200.55 in the second quarter of 2019, up from 189.8 in the same quarter a year earlier, and 182.16 in Q2 2017. Keep in mind that these increases are occurring at a time when there has been relatively little inflation in the economy.

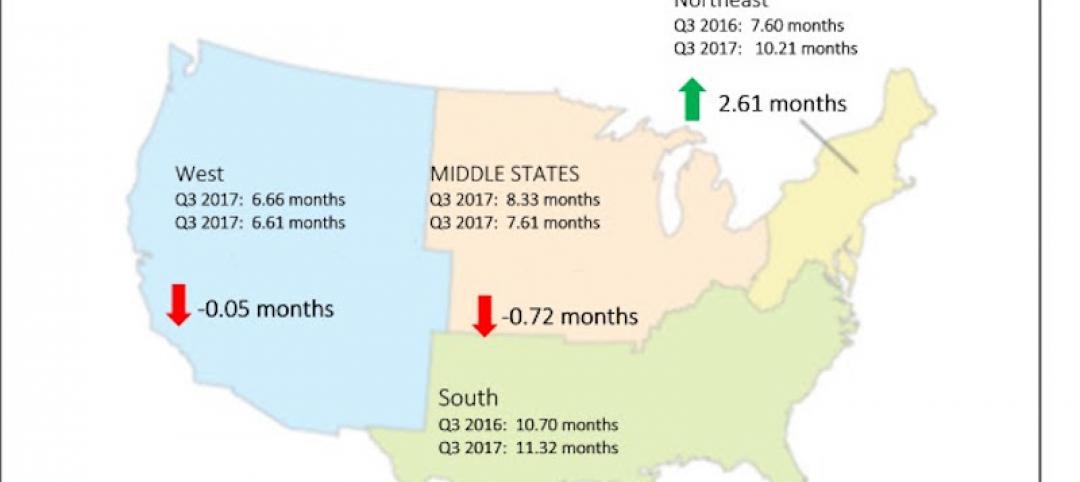
The construction backlog in North America was more than nine months in the second quarter. Image: Rider Levett Bucknall, from Associated Builders and Contractors estimates.
RLB's estimates are in line Turner Construction's quarterly Building Cost Index (https://bit.ly/2xWrf61), which the GC giant released on July 16. That Index, at 1149, was up 1.23% over the first quarter, and 5.51% over the second quarter of 2018. “Contractors continue to be selective due to the availability of skilled labor,” wrote Attilio Rivetti, Turner's vice president responsible for compiling its cost index.
To further make its case, RLB cites the Associated Builders and Contractors’ Construction Backlog Indicator, which reflects the amount of work that will be performed by commercial and industrial contractors in the months ahead. The backlog for 2018 averaged 9.15 months, slightly below the 2017 average but still up 17% from 2011.
The report breaks down current building costs by market and by seven typologies: offices, retail, hotels, hospitals, warehouses, parking, and residential. For example, Las Vegas, Phoenix, Portland, Seattle, and Denver continue to be relative bargains for office construction, based on their costs per sf. Los Angeles, Washington DC, and New York are the high-priced spreads when building hospitals. As for hotel construction, Honolulu and San Francisco are priciest.
Overall, Chicago experienced the greatest increase in construction bid costs (including materials, labor, and fees), 8.77%, between April 2018 and April 2019, followed San Francisco (7.05%), Portland (6.82%), Seattle (6.68%), Phoenix (6.47%), and Honolulu (5.83%), all above the national average increase.
Los Angeles, while no slouch on the construction front, was the only metro that RLB tracks that experienced a decrease in construction costs in the second quarter, down 1.22%.

Chicago experienced the highest percentage increase in quarterly construction costs. Image: Rider Levett Bucknall
Through the first quarter of 2019, construction unemployment remained steady at 5.2%. The vast majority of construction firms are still having trouble filling open positions. And this situation could worsen, according to the Associated General Contractors of America, as a result of the Trump Administration’s proposal, announced last month, which would exclude the construction sector from the Labor Department’s apprenticeship framework. (Currently, more than three quarters of the federally administered apprenticeships in the U.S. are either in construction or part of military training, notes RLB.)
In a separate report that gauges construction activity by the number of cranes in use in North America, RLB’s July survey marked the fourth consecutive increase. However, only two of 11 U.S. markets tracked—Los Angeles and Denver—saw an increase in cranes. Five other cities were steady.
Cranes for commercial projects were up nationally and accounted for 41% of the cranes in use in New York City. In all markets, mixed-use and multifamily residential construction accounted for 67% of the cranes counted. In Seattle alone, mixed use and residential required 78% of cranes used.
Related Stories

Market Data | Dec 13, 2017
Top world regions and markets in the global hotel construction pipeline
The top world region by project count is North America.

Market Data | Dec 11, 2017
Global hotel construction pipeline is growing
The Total Pipeline stands at 12,427 Projects/2,084,940 Rooms.
Market Data | Dec 11, 2017
Construction backlog surges, sets record in third quarter
CBI is a leading economic indicator that reflects the amount of construction work under contract, but not yet completed.
Market Data | Dec 7, 2017
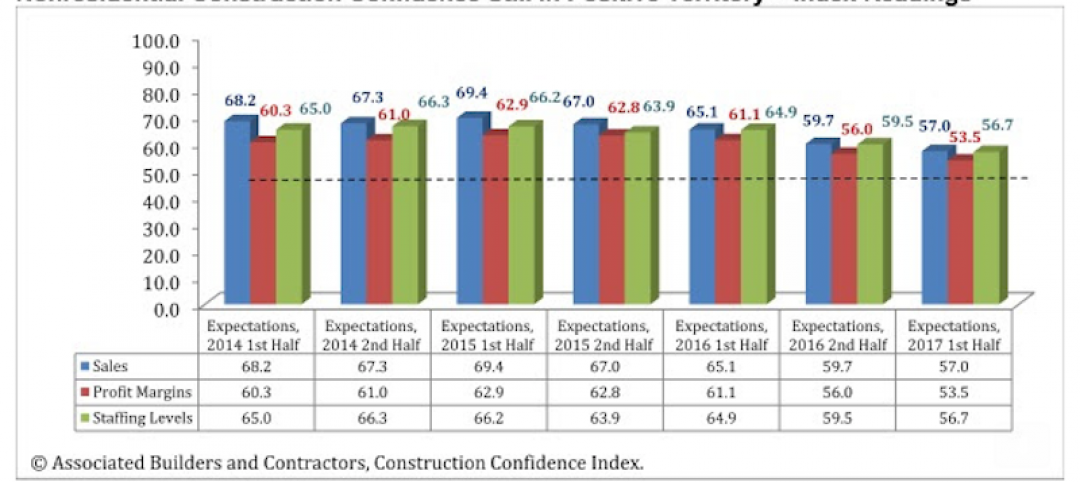
Buoyed by healthy economy, ABC Index finds contractors upbeat
Despite rising construction labor and materials costs, 55% of contractors expect their profit margins to expand in the first half of 2018.

Market Data | Dec 5, 2017
Top health systems engaged in $21 billion of U.S. construction projects
Largest active projects are by Sutter Health, New York Presbyterian, and Scripps Health.

Industry Research | Nov 28, 2017
2018 outlook: Economists point to slowdown, AEC professionals say ‘no way’
Multifamily housing and senior living developments head the list of the hottest sectors heading into 2018, according a survey of 356 AEC professionals.
Market Data | Nov 27, 2017
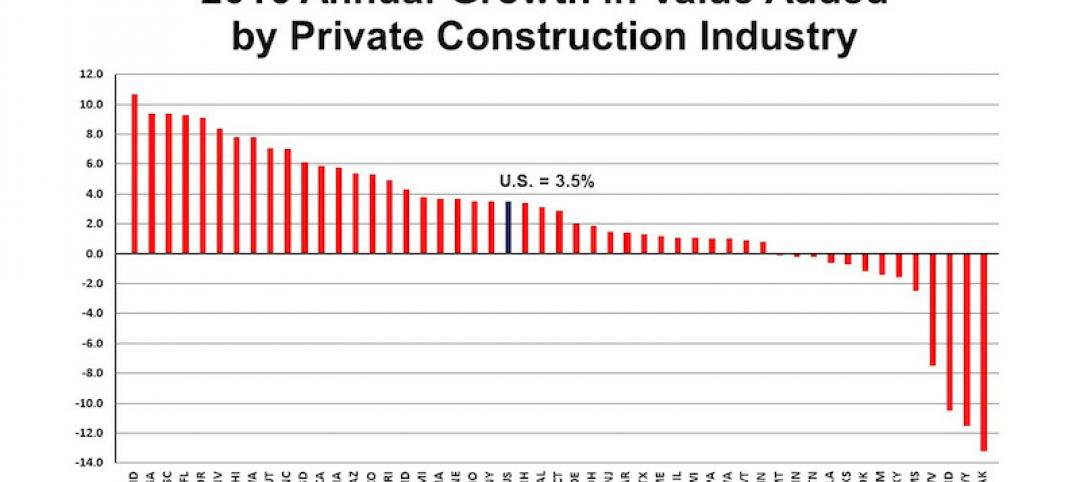
Construction's contribution to U.S. economy highest in seven years
Thirty-seven states benefited from the rise in construction activity in their state, while 13 states experienced a reduction in activity.
Market Data | Nov 15, 2017
Architecture Billings bounce back
Business conditions remain uneven across regions.
Market Data | Nov 14, 2017
U.S. construction starts had three consecutive quarters of positive growth in 2017
ConstructConnect’s quarterly report shows the most significant annual growth in the civil engineering and residential sectors.

Market Data | Nov 3, 2017
New construction starts in 2018 to increase 3% to $765 billion: Dodge report
Dodge Outlook Report predicts deceleration but still growth, reflecting a mixed pattern by project type.


