


Through April of this year, the national average increase in construction cost was 4.48%, annualized. Construction put in place during April 2019, at a seasonally adjusted annualized rate of $1.299 trillion, was 1.2% below construction put in place in April 2018.
In its just-released second quarter Construction Cost Report for North America, which is based on data from a dozen U.S. markets ansdn two Canadian markets, the construction management consultant Rider Levett Bucknall reiterates the financial and time impacts that the shortage of qualified trade workers is having on the construction industry’s productivity and expansion.
“Even as technology transforms the jobsite, improving both efficiency and worker safety, skilled-labor recruitment and retention are essential to the future of construction,” writes Julian Anderson, FRICS, Rider Levett Bucknall’s President-North America. “As worker shortage makes projects more costly and slower to build, the risk of undermining broader economic growth increases.”
RLB’s National Construction Cost Index stood at 200.55 in the second quarter of 2019, up from 189.8 in the same quarter a year earlier, and 182.16 in Q2 2017. Keep in mind that these increases are occurring at a time when there has been relatively little inflation in the economy.

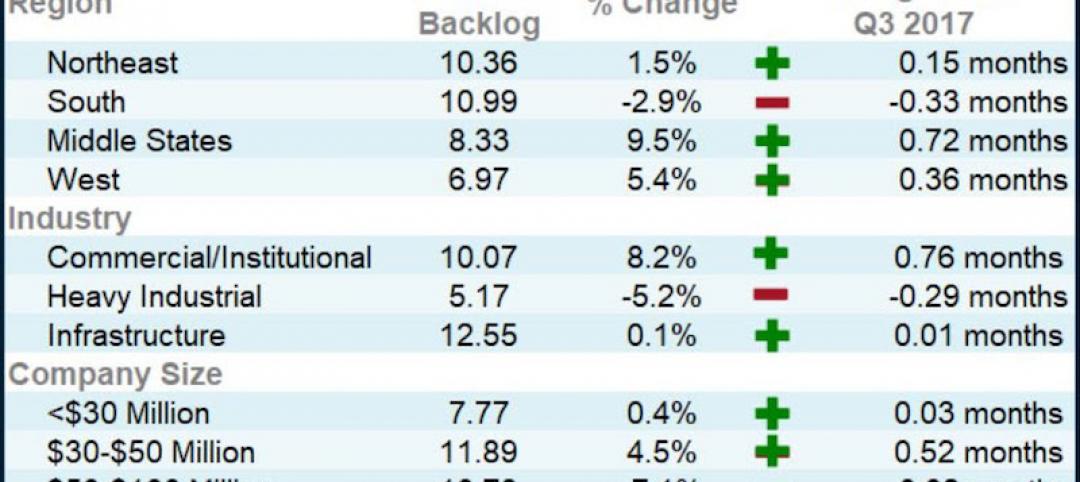
The construction backlog in North America was more than nine months in the second quarter. Image: Rider Levett Bucknall, from Associated Builders and Contractors estimates.
RLB's estimates are in line Turner Construction's quarterly Building Cost Index (https://bit.ly/2xWrf61), which the GC giant released on July 16. That Index, at 1149, was up 1.23% over the first quarter, and 5.51% over the second quarter of 2018. “Contractors continue to be selective due to the availability of skilled labor,” wrote Attilio Rivetti, Turner's vice president responsible for compiling its cost index.
To further make its case, RLB cites the Associated Builders and Contractors’ Construction Backlog Indicator, which reflects the amount of work that will be performed by commercial and industrial contractors in the months ahead. The backlog for 2018 averaged 9.15 months, slightly below the 2017 average but still up 17% from 2011.
The report breaks down current building costs by market and by seven typologies: offices, retail, hotels, hospitals, warehouses, parking, and residential. For example, Las Vegas, Phoenix, Portland, Seattle, and Denver continue to be relative bargains for office construction, based on their costs per sf. Los Angeles, Washington DC, and New York are the high-priced spreads when building hospitals. As for hotel construction, Honolulu and San Francisco are priciest.
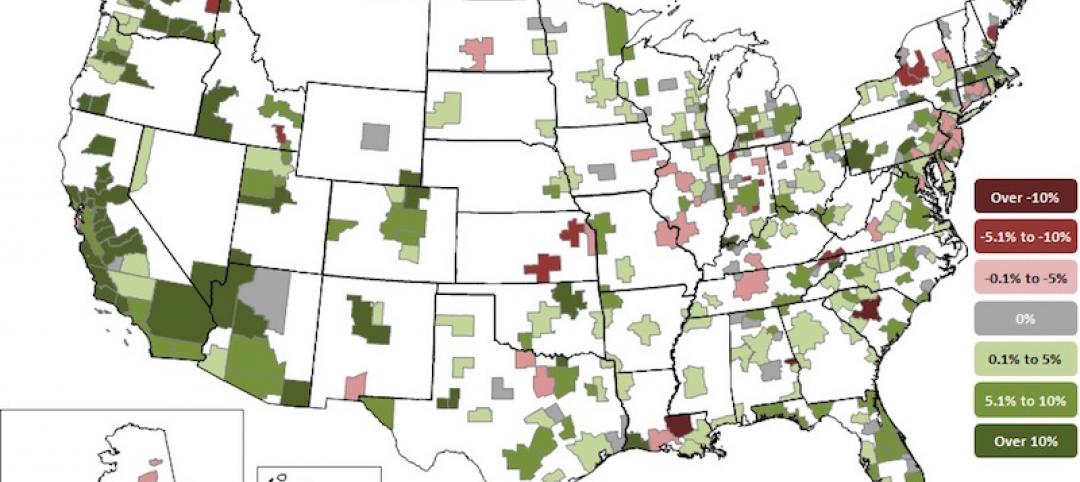
Overall, Chicago experienced the greatest increase in construction bid costs (including materials, labor, and fees), 8.77%, between April 2018 and April 2019, followed San Francisco (7.05%), Portland (6.82%), Seattle (6.68%), Phoenix (6.47%), and Honolulu (5.83%), all above the national average increase.
Los Angeles, while no slouch on the construction front, was the only metro that RLB tracks that experienced a decrease in construction costs in the second quarter, down 1.22%.

Chicago experienced the highest percentage increase in quarterly construction costs. Image: Rider Levett Bucknall
Through the first quarter of 2019, construction unemployment remained steady at 5.2%. The vast majority of construction firms are still having trouble filling open positions. And this situation could worsen, according to the Associated General Contractors of America, as a result of the Trump Administration’s proposal, announced last month, which would exclude the construction sector from the Labor Department’s apprenticeship framework. (Currently, more than three quarters of the federally administered apprenticeships in the U.S. are either in construction or part of military training, notes RLB.)
In a separate report that gauges construction activity by the number of cranes in use in North America, RLB’s July survey marked the fourth consecutive increase. However, only two of 11 U.S. markets tracked—Los Angeles and Denver—saw an increase in cranes. Five other cities were steady.
Cranes for commercial projects were up nationally and accounted for 41% of the cranes in use in New York City. In all markets, mixed-use and multifamily residential construction accounted for 67% of the cranes counted. In Seattle alone, mixed use and residential required 78% of cranes used.
Related Stories
Market Data | Apr 4, 2018
Construction employment increases in 257 metro areas between February 2017 & 2018 as construction firms continue to expand amid strong demand
Riverside-San Bernardino-Ontario, Calif. and Merced, Calif. experience largest year-over-year gains; Baton Rouge, La. and Auburn-Opelika, Ala. have biggest annual declines in construction employment.
Market Data | Apr 2, 2018
Construction spending in February inches up from January
Association officials urge federal, state and local officials to work quickly to put recently enacted funding increases to work to improve aging and over-burdened infrastructure, offset public-sector spending drops.

Market Data | Mar 29, 2018
AIA and the University of Minnesota partner to develop Guides for Equitable Practice
The Guides for Equitable Practice will be developed and implemented in three phase.

Market Data | Mar 22, 2018
Architecture billings continue to hold positive in 2018
Billings particularly strong at firms in the West and Midwest regions.
Market Data | Mar 21, 2018
Construction employment increases in 248 metro areas as new metal tariffs threaten future sector job gains
Riverside-San Bernardino-Ontario, Calif., and Merced, Calif., experience largest year-over-year gains; Baton Rouge, La., and Auburn-Opelika, Ala., have biggest annual declines in construction employment.
Market Data | Mar 19, 2018
ABC's Construction Backlog Indicator hits a new high: 2018 poised to be a very strong year for construction spending
CBI is up by 1.36 months, or 16.3%, on a year-over-year basis.

Market Data | Mar 15, 2018
ABC: Construction materials prices continue to expand briskly in February
Compared to February 2017, prices are up 5.2%.

Market Data | Mar 14, 2018
AGC: Tariff increases threaten to make many project unaffordable
Construction costs escalated in February, driven by price increases for a wide range of building materials, including steel and aluminum.
Market Data | Mar 12, 2018
Construction employers add 61,000 jobs in February and 254,000 over the year
Hourly earnings rise 3.3% as sector strives to draw in new workers.

Steel Buildings | Mar 9, 2018
New steel and aluminum tariffs will hurt construction firms by raising materials costs; potential trade war will dampen demand, says AGC of America
Independent studies suggest the construction industry could lose nearly 30,000 jobs as a result of administration's new tariffs as many firms will be forced to absorb increased costs.


