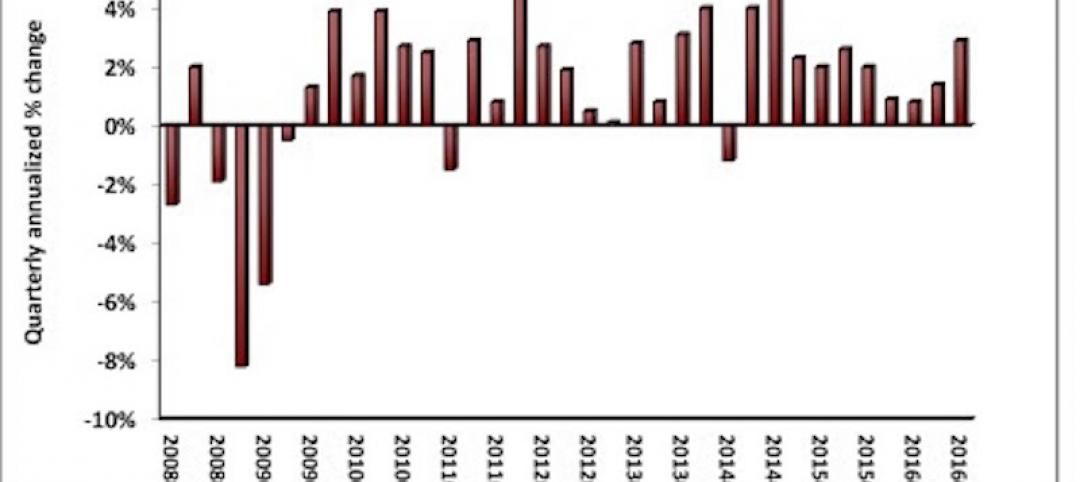
A typical change for construction starts between February and March is around +2.5%. This year, however, dwarfed that, as commercial construction starts climbed 18% from February to March to $28.5 billion, Construction Market Data reports. This is a significant spike even when compared to the typical March to April jump of 12%.
While the number of starts in March 2016 was not much different from March 2015 (+1.6 percent), the number of starts over the first three months of 2016 was 9.8% higher than the first quarter of 2015. The report also notes that February’s starts underwent an upward revision from $19.1 billion to 24.1 billion. The largest adjustments occurred in the structure categories of parking garages, private office buildings, and hospitals/clinics.
The construction sector added 37,000 jobs in March, which is the largest gain so far this year. The first three months of the year have seen an average gain of 25,000 jobs, or an increase of 7.1 percent compared to the 23,000 job-per-month average in Q1 2015. The year-over-year employment in construction for March was 4.7 percent, much faster than the pace for all jobs in the economy. March’s jobless rate for the construction sector was 8.7 percent, not great, but an improvement of March 2015’s 9.5 percent.
Among the types of construction that make up nonresidential building, commercial structures and institutional structures saw the largest change between the first quarter of 2016 and the first quarter of 2015 at +19.9% and +19.5% respectively. Heavy engineering has seen a smaller increase at 5.8%. Meanwhile, industrial construction dropped 59.3%.
Private office buildings accounted for the majority of construction starts in the commercial category with a total of $6.059 billion in the first quarter. Among institutional structures, school and college starts have been responsible for over half of the category’s construction so far with a total of $13.426 billion. Roads and bridges made up over a third of the heavy engineering category with $10.967 billion.
The South and the West saw the largest increases in commercial construction between first quarter 2015 and first quarter 2016 while the Midwest and Northeast saw regressions. The West was up 27.6% from 2015 and the South was up 18%. The Midwest dropped 9.1% and the northeast dropped 6.6%. On the whole, the U.S. has seen a 9.8% increase between 2015 and 2016 so far.
Overall, nonresidential building and engineering/civil work accounts for 62% of total construction in the country with residential activity accounting for 38%.
All of the starts figures found throughout CMD’s report are not seasonally adjusted or altered for inflation. They are expressed in ‘current’ as opposed to ‘constant’ dollars.
To read the report in its entirety and to view accompanying graphs, click here.
Related Stories
Industry Research | Nov 28, 2016
Building America: The Merit Shop Scorecard
ABC releases state rankings on policies affecting construction industry.
Market Data | Nov 17, 2016
Architecture Billings Index rebounds after two down months
Decline in new design contracts suggests volatility in design activity to persist.
Industry Research | Nov 8, 2016
Austin, Texas wins ‘Top City’ in the Emerging Trends in Real Estate outlook
Austin was followed on the list by Dallas/Fort Worth, Texas and Portland, Ore.
Industry Research | Nov 4, 2016
New survey exposes achievement gap between men and women designers
Female architects still feel disadvantaged when it comes to career advancement.
Market Data | Nov 2, 2016
Nonresidential construction spending down in September, but August data upwardly revised
The government revised the August nonresidential construction spending estimate from $686.6 billion to $696.6 billion.
Industry Research | Nov 1, 2016
Perkins Eastman Research releases white paper on ‘Centers for Healthy Living’ and whole-person wellness
Among the spotlight projects used as case studies for this white paper are C.C. Young, Dallas, Texas; Clark-Lindsey Village, Urbana, Ill.; Moorings Park, Naples, Fla.; NewBridge on the Charles, Dedham, Mass.; Rockwood Retirement Living: The Summit, Spokane, Wash.; Saint John’s on the Lake, Milwaukee, Wis.; and Spring Lake Village, Santa Rosa, Calif.
Market Data | Oct 31, 2016
Nonresidential fixed investment expands again during solid third quarter
The acceleration in real GDP growth was driven by a combination of factors, including an upturn in exports, a smaller decrease in state and local government spending and an upturn in federal government spending, says ABC Chief Economist Anirban Basu.
Market Data | Oct 28, 2016
U.S. construction solid and stable in Q3 of 2016; Presidential election seen as influence on industry for 2017
Rider Levett Bucknall’s Third Quarter 2016 USA Construction Cost Report puts the complete spectrum of construction sectors and markets in perspective as it assesses the current state of the industry.
Industry Research | Oct 25, 2016
New HOK/CoreNet Global report explores impact of coworking on corporate real rstate
“Although coworking space makes up less than one percent of the world’s office space, it represents an important workforce trend and highlights the strong desire of today’s employees to have workplace choices, community and flexibility,” says Kay Sargent, Director of WorkPlace at HOK.
Market Data | Oct 24, 2016
New construction starts in 2017 to increase 5% to $713 billion
Dodge Outlook Report predicts moderate growth for most project types – single family housing, commercial and institutional building, and public works, while multifamily housing levels off and electric utilities/gas plants decline.


