


Data is one of those broad, overarching commodities (and it is just that, a commodity) that is of great importance regardless of which sector of the economy or what type of business individuals may find themselves working in. The problem with data, is it is often times presented in such a way, such as dense spreadsheets, that it is nothing more than a kaleidoscope of numbers requiring "a beautiful mind" like that of John Nash to actually make any sense of what the spreadsheets are actually saying. Numbers may not lie, but they certainly aren’t very loose-lipped with the truth, either.
In an effort to get the numbers and statistics, in regards to transit data, to be a bit more garrulous about the truths they hold, The Center for Neighborhood Technology (CNT), with funding from TransitCenter, has launched AllTransit, the largest source of transit connectivity, access, and frequency data in the United States. The data found on the website can help to enhance service and operations planning and also create the potential for planning applications to increase our understanding of the value of transit, according to AllTransit’s website.
The data is compiled from a combination of publicly available General Transit Feed Specification (GTFS) data as well as through information gained by CNT contacting transit agencies directly in order to obtain more specific information on stop locations and schedules.
Station, stop, and frequency data for bus, rail, and ferry service for all major agencies in regions with populations over 100,000 is available. Additionally, data for many smaller agencies and regions can be found, as well.
The goal behind the website is to gather the data and present it in the most user-friendly way possible. You can head to the website, click on the ‘Transit Metrics’ tab, and plug in your zip code or city name to find transit data in regards to jobs, economy, health, equity, transit quality, and mobility.
For example, Arlington Heights, Ill., has 64,805 jobs accessible within a 30-minute transit commute on average for households and 27,415 jobs that are located with a ½ mile of transit. These categories can be broken down further to see jobs by type, educational attainment, and earnings. The economy section shows 25,836 customer households accessible to an employer within a 30-minute transit commute. Meanwhile, among the information displayed in the "Health" section, the percentage of workers who commute by bicycle (0.34%) and those who commute by walking and live within a ½ mile of transit (2.21%) is shown. Each of the other sections provides just as much or more information on the location entered and a constant sidebar shows some of the major numbers in regards to transit, such as the AllTransit Performance Score, which is an overall transit score that looks at connectivity, access to jobs, and frequency and service.
The sheer amount of data and its user-friendly package makes AllTransit a useful source for anyone ranging from elected officials, transit advocates, and researchers to business owners and city residents. Plus, you won’t feel like you need to hold a doctorate in Mathematics to decipher it.
Related Stories
AEC Tech | Aug 24, 2017
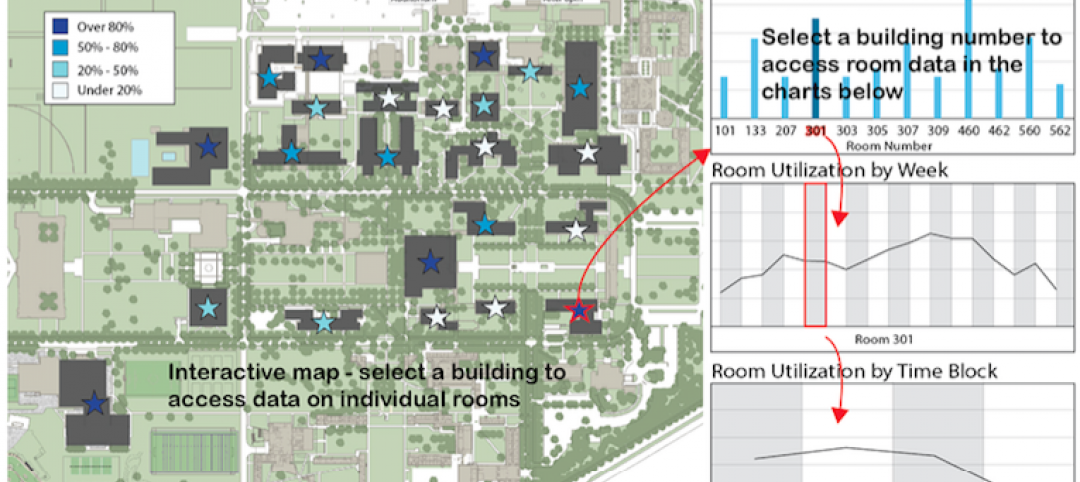
Big Data helps space optimization, but barriers remain
Space optimization is a big issue on many university campuses, as schools face increasing financial constraints, writes Hanbury’s Jimmy Stevens.
| Jun 13, 2017
Accelerate Live! talk: A case for Big Data in construction, Graham Cranston, Simpson Gumpertz & Heger
Graham Cranston shares SGH’s efforts to take hold of its project data using mathematical optimization techniques and information-rich interactive visual graphics.
| May 24, 2017
Accelerate Live! talk: Applying machine learning to building design, Daniel Davis, WeWork
Daniel Davis offers a glimpse into the world at WeWork, and how his team is rethinking workplace design with the help of machine learning tools.
| May 24, 2017
Accelerate Live! talk: Learning from Silicon Valley - Using SaaS to automate AEC, Sean Parham, Aditazz
Sean Parham shares how Aditazz is shaking up the traditional design and construction approaches by applying lessons from the tech world.
| May 24, 2017
Accelerate Live! talk: The data-driven future for AEC, Nathan Miller, Proving Ground
In this 15-minute talk at BD+C’s Accelerate Live! (May 11, 2017, Chicago), Nathan Miller presents his vision of a data-driven future for the business of design.
Big Data | May 24, 2017
Data literacy: Your data-driven advantage starts with your people
All too often, the narrative of what it takes to be ‘data-driven’ focuses on methods for collecting, synthesizing, and visualizing data.
Sustainable Design and Construction | Apr 5, 2017
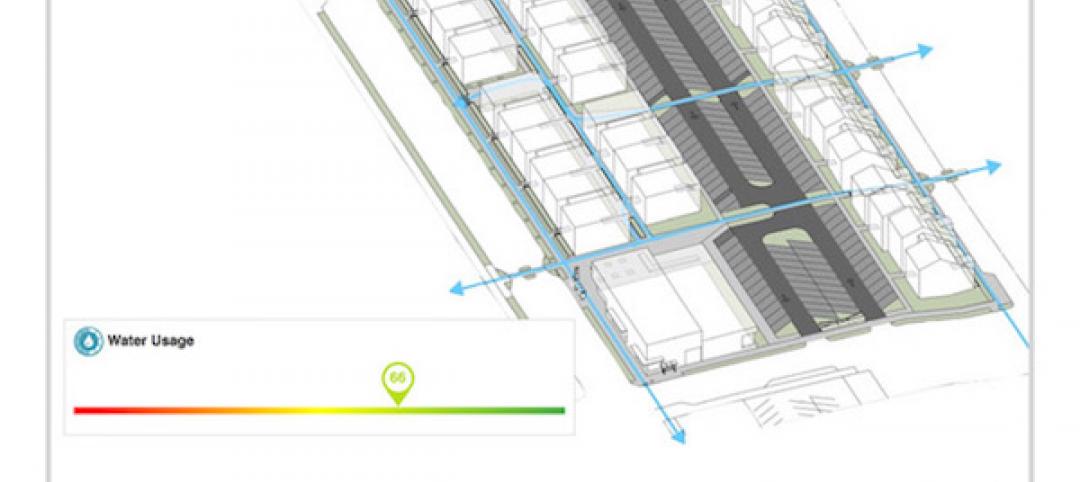
A new app brings precision to designing a building for higher performance
PlanIt Impact's sustainability scoring is based on myriad government and research data.

AEC Tech | Dec 18, 2016
Customized future weather data now available for online purchase
Simulation tool, developed by Arup and Argos Analytics, is offered to help owners and AEC firms devise resilience strategies for buildings.

Big Data | May 27, 2016
Analytics alone won't save money for healthcare facility owners
Advanced technology provides insight into the actions necessary to cut costs, but it's the people, processes, and implementation that make a difference with analytics, writes CBRE's Paul Oswald.

Big Data | May 9, 2016
City planners find value in data from Strava, a cyclist tracking app
More than 75 metro areas around the world examine cyclists’ routes and speeds that the app has recorded.


