


Data is one of those broad, overarching commodities (and it is just that, a commodity) that is of great importance regardless of which sector of the economy or what type of business individuals may find themselves working in. The problem with data, is it is often times presented in such a way, such as dense spreadsheets, that it is nothing more than a kaleidoscope of numbers requiring "a beautiful mind" like that of John Nash to actually make any sense of what the spreadsheets are actually saying. Numbers may not lie, but they certainly aren’t very loose-lipped with the truth, either.
In an effort to get the numbers and statistics, in regards to transit data, to be a bit more garrulous about the truths they hold, The Center for Neighborhood Technology (CNT), with funding from TransitCenter, has launched AllTransit, the largest source of transit connectivity, access, and frequency data in the United States. The data found on the website can help to enhance service and operations planning and also create the potential for planning applications to increase our understanding of the value of transit, according to AllTransit’s website.
The data is compiled from a combination of publicly available General Transit Feed Specification (GTFS) data as well as through information gained by CNT contacting transit agencies directly in order to obtain more specific information on stop locations and schedules.
Station, stop, and frequency data for bus, rail, and ferry service for all major agencies in regions with populations over 100,000 is available. Additionally, data for many smaller agencies and regions can be found, as well.
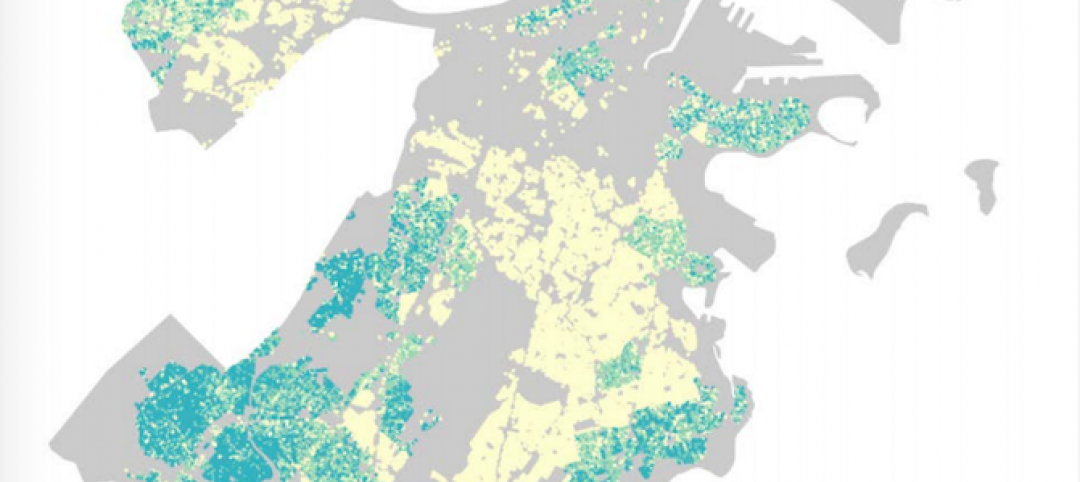
The goal behind the website is to gather the data and present it in the most user-friendly way possible. You can head to the website, click on the ‘Transit Metrics’ tab, and plug in your zip code or city name to find transit data in regards to jobs, economy, health, equity, transit quality, and mobility.
For example, Arlington Heights, Ill., has 64,805 jobs accessible within a 30-minute transit commute on average for households and 27,415 jobs that are located with a ½ mile of transit. These categories can be broken down further to see jobs by type, educational attainment, and earnings. The economy section shows 25,836 customer households accessible to an employer within a 30-minute transit commute. Meanwhile, among the information displayed in the "Health" section, the percentage of workers who commute by bicycle (0.34%) and those who commute by walking and live within a ½ mile of transit (2.21%) is shown. Each of the other sections provides just as much or more information on the location entered and a constant sidebar shows some of the major numbers in regards to transit, such as the AllTransit Performance Score, which is an overall transit score that looks at connectivity, access to jobs, and frequency and service.
The sheer amount of data and its user-friendly package makes AllTransit a useful source for anyone ranging from elected officials, transit advocates, and researchers to business owners and city residents. Plus, you won’t feel like you need to hold a doctorate in Mathematics to decipher it.
Related Stories

Big Data | Aug 23, 2018
Data driven design: The benefits of building energy modeling
As technology advances, Building Energy Modeling (BEM) is becoming an even more powerful tool for making informed design decisions. This is the first post in our series examining the benefits of BEM in balancing occupant comfort and design features with energy efficiency.

BIM and Information Technology | Jul 2, 2018
Data, Dynamo, and design iteration
We’re well into the digital era of architecture which favors processes that have a better innovation cycle.

Accelerate Live! | Jun 24, 2018
Watch all 19 Accelerate Live! talks on demand
BD+C’s second annual Accelerate Live! AEC innovation conference (May 10, 2018, Chicago) featured talks on AI for construction scheduling, regenerative design, the micro-buildings movement, post-occupancy evaluation, predictive visual data analytics, digital fabrication, and more. Take in all 19 talks on demand.

Market Data | Jun 18, 2018
AI is the path to maximum profitability for retail and FMCG firms
Leading retailers including Amazon, Alibaba, Lowe’s and Tesco are developing their own AI solutions for automation, analytics and robotics use cases.
| Jun 11, 2018
Accelerate Live! talk: ‘AEC can has Blockchains?’
In this 15-minute talk at BD+C’s Accelerate Live! conference (May 10, 2018, Chicago), HOK’s Greg Schleusner explores how the AEC industry could adapt the best ideas from other industries (banking, manufacturing, tech) to modernize inefficient design and construction processes.
| May 30, 2018
Accelerate Live! talk: Seven technologies that restore glory to the master builder
In this 15-minute talk at BD+C’s Accelerate Live! conference (May 10, 2018, Chicago), AEC technophile Rohit Arora outlines emerging innovations that are poised to transform how we design and build structures in the near future.

Big Data | Jan 5, 2018
In the age of data-driven design, has POE’s time finally come?
At a time when research- and data-based methods are playing a larger role in architecture, there remains a surprisingly scant amount of post-occupancy research. But that’s starting to change.
Green | Dec 22, 2017
Green builders can use ‘big data’ to make design decisions
More and more, green project teams are relying on publicly available “external datasets” to prioritize sustainable design decisions, says sustainability consultant Adele Houghton.
Reconstruction & Renovation | Dec 21, 2017
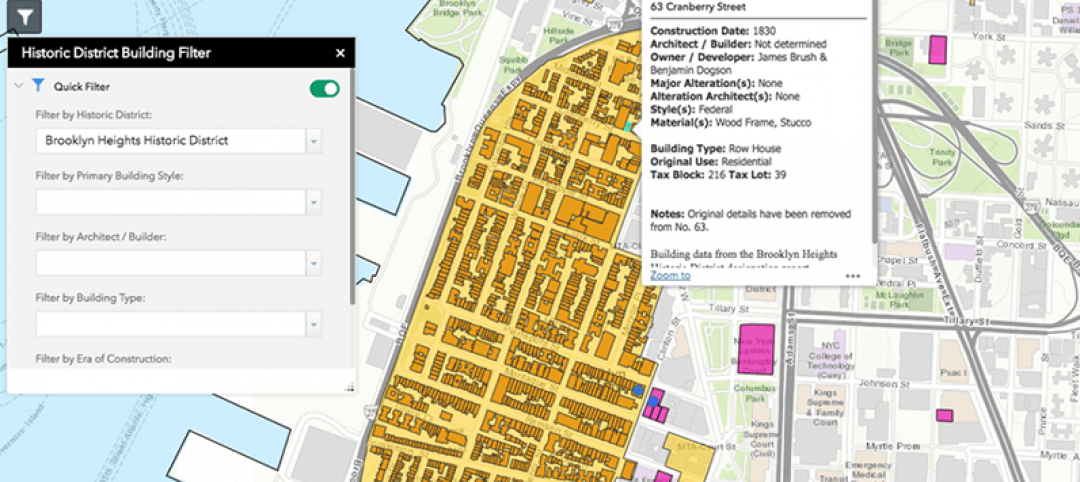
Interactive map includes detailed information on historic New York City buildings
The New York City Landmarks Preservation Commission launched a new, enhanced version of its interactive map, Discover NYC Landmarks.

AEC Tech | Oct 6, 2017
How professional bias can sabotage industry transformation
Professional bias can take the form of change-resistant thinking that can keep transformational or innovative ambitions at bay. Tech consultant Nate Miller presents three kinds of bias that often emerge when a professional is confronted with new technology.


