


A slight improvement in business conditions has led to fewer architecture firms reporting declining billings, according to a new report today from The American Institute of Architects (AIA).
AIA’s Architecture Billings Index (ABI) score for January was 44.9* compared to 42.3 in December (any score below 50 indicates a decline in firm billings). Last month’s score indicates overall revenue at U.S architecture firms continued to decline from December to January, however, the pace of decline slowed. Inquiries into new projects during January grew for the second month in a row, with a score of 56.8 compared to 51.7 in December. The value of new design contracts also reflected an easing in the pace of decline, rising to a score of 48.8 in January from 47.0 the previous month.
“The broader economy entered a soft spot during the fourth quarter of last year, and business conditions at design firms have reflected this general slowdown,” said AIA Chief Economist, Kermit Baker, Hon. AIA, PhD. “While federal stimulus and the increasing pace of vaccinations may begin to accelerate progress in the coming months, the year has gotten off to a slow start, with architecture firms in all regions of the country and in all specializations reporting continued declines in project billings.”
Key ABI highlights for January include:
- Regional averages: South (47.4); West (42.8); Midwest (42.2); Northeast (41.9)
- Sector index breakdown: mixed practice (47.9); multi-family residential (44.4); commercial/industrial (44.3); institutional (39.9)
- Project inquiries index: 56.8
- Design contracts index: 48.8
The regional and sector categories are calculated as a three-month moving average, whereas the national index, design contracts and inquiries are monthly numbers.
To learn more about recent economic developments impacting design and construction, visit AIA’s website.
*Every January the AIA research department updates the seasonal factors used to calculate the ABI, resulting in a revision of recent ABI values.
Related Stories

Market Data | Oct 19, 2021
Demand for design services continues to increase
The Architecture Billings Index (ABI) score for September was 56.6.
Market Data | Oct 14, 2021
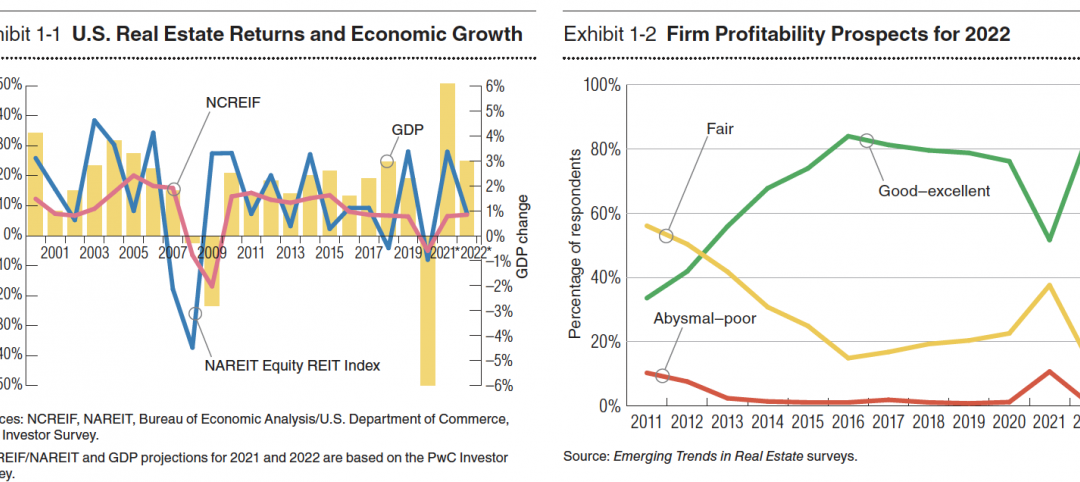
Climate-related risk could be a major headwind for real estate investment
A new trends report from PwC and ULI picks Nashville as the top metro for CRE prospects.
Market Data | Oct 14, 2021
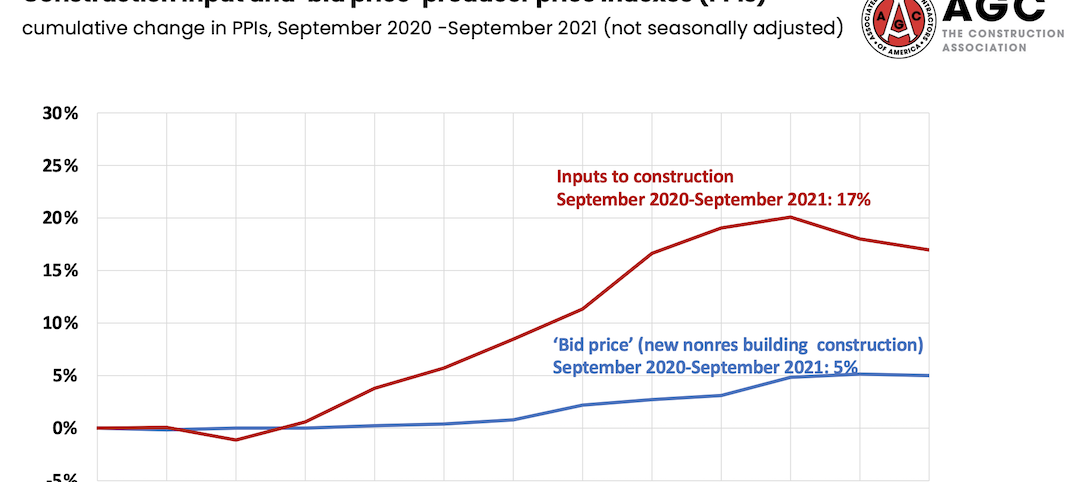
Prices for construction materials continue to outstrip bid prices over 12 months
Construction officials renew push for immediate removal of tariffs on key construction materials.
Market Data | Oct 11, 2021
No decline in construction costs in sight
Construction cost gains are occurring at a time when nonresidential construction spending was down by 9.5 percent for the 12 months through July 2021.
Market Data | Oct 11, 2021
Nonresidential construction sector posts first job gain since March
Has yet to hit pre-pandemic levels amid supply chain disruptions and delays.
Market Data | Oct 4, 2021
Construction spending stalls between July and August
A decrease in nonresidential projects negates ongoing growth in residential work.
Market Data | Oct 1, 2021
Nonresidential construction spending dips in August
Spending declined on a monthly basis in 10 of the 16 nonresidential subcategories.
Market Data | Sep 29, 2021
One-third of metro areas lost construction jobs between August 2020 and 2021
Lawrence-Methuen Town-Salem, Mass. and San Diego-Carlsbad, Calif. top lists of metros with year-over-year employment increases.
Market Data | Sep 28, 2021
Design-Build projects should continue to take bigger shares of construction spending pie over next five years
FMI’s new study finds collaboration and creativity are major reasons why owners and AEC firms prefer this delivery method.
Market Data | Sep 22, 2021
Architecture billings continue to increase
The ABI score for August was 55.6, up from July’s score of 54.6.


