


A slight improvement in business conditions has led to fewer architecture firms reporting declining billings, according to a new report today from The American Institute of Architects (AIA).
AIA’s Architecture Billings Index (ABI) score for January was 44.9* compared to 42.3 in December (any score below 50 indicates a decline in firm billings). Last month’s score indicates overall revenue at U.S architecture firms continued to decline from December to January, however, the pace of decline slowed. Inquiries into new projects during January grew for the second month in a row, with a score of 56.8 compared to 51.7 in December. The value of new design contracts also reflected an easing in the pace of decline, rising to a score of 48.8 in January from 47.0 the previous month.
“The broader economy entered a soft spot during the fourth quarter of last year, and business conditions at design firms have reflected this general slowdown,” said AIA Chief Economist, Kermit Baker, Hon. AIA, PhD. “While federal stimulus and the increasing pace of vaccinations may begin to accelerate progress in the coming months, the year has gotten off to a slow start, with architecture firms in all regions of the country and in all specializations reporting continued declines in project billings.”
Key ABI highlights for January include:
- Regional averages: South (47.4); West (42.8); Midwest (42.2); Northeast (41.9)
- Sector index breakdown: mixed practice (47.9); multi-family residential (44.4); commercial/industrial (44.3); institutional (39.9)
- Project inquiries index: 56.8
- Design contracts index: 48.8
The regional and sector categories are calculated as a three-month moving average, whereas the national index, design contracts and inquiries are monthly numbers.
To learn more about recent economic developments impacting design and construction, visit AIA’s website.
*Every January the AIA research department updates the seasonal factors used to calculate the ABI, resulting in a revision of recent ABI values.
Related Stories
Market Data | Sep 28, 2021
Design-Build projects should continue to take bigger shares of construction spending pie over next five years
FMI’s new study finds collaboration and creativity are major reasons why owners and AEC firms prefer this delivery method.
Market Data | Sep 22, 2021
Architecture billings continue to increase
The ABI score for August was 55.6, up from July’s score of 54.6.

Market Data | Sep 20, 2021
August construction employment lags pre-pandemic peak in 39 states
The coronavirus delta variant and supply problems hold back recovery.
Market Data | Sep 15, 2021
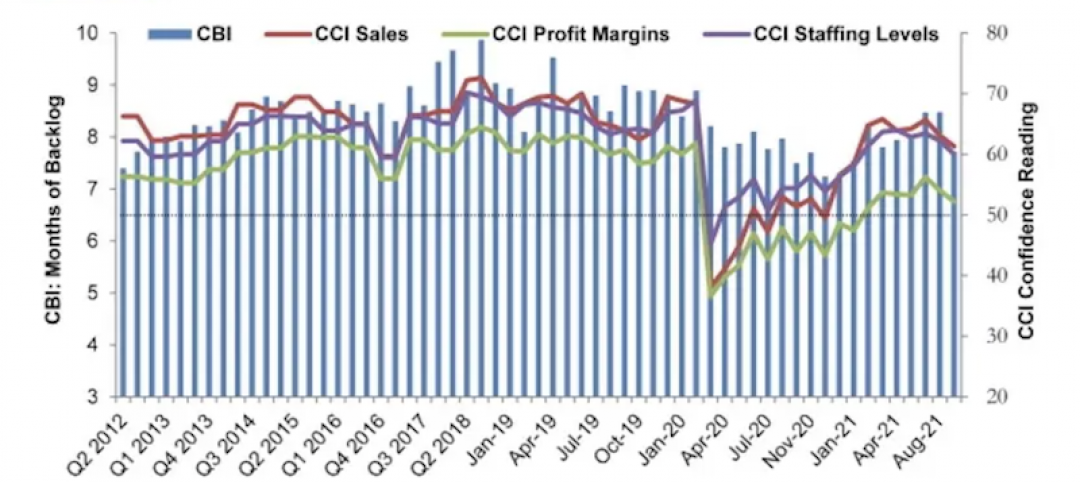
ABC’s Construction Backlog Indicator plummets in August; Contractor Confidence down
ABC’s Construction Confidence Index readings for sales, profit margins and staffing levels all fell modestly in August.
Market Data | Sep 7, 2021
Construction sheds 3,000 jobs in August
Gains are limited to homebuilding as other contractors struggle to fill both craft and salaried positions.

Market Data | Sep 3, 2021
Construction workforce shortages reach pre-pandemic levels
Coronavirus continues to impact projects and disrupt supply chains.

Multifamily Housing | Sep 1, 2021
Top 10 outdoor amenities at multifamily housing developments for 2021
Fire pits, lounge areas, and covered parking are the most common outdoor amenities at multifamily housing developments, according to new research from Multifamily Design+Construction.

Market Data | Sep 1, 2021
Construction spending posts small increase in July
Coronavirus, soaring costs, and supply disruptions threaten to erase further gains.
Market Data | Sep 1, 2021
Bradley Corp. survey finds office workers taking coronavirus precautions
Due to the rise in new strains of the virus, 70% of office workers have implemented a more rigorous handwashing regimen versus 59% of the general population.
Market Data | Aug 31, 2021
Three out of four metro areas add construction jobs from July 2020 to July 2021
COVID, rising costs, and supply chain woes may stall gains.


