


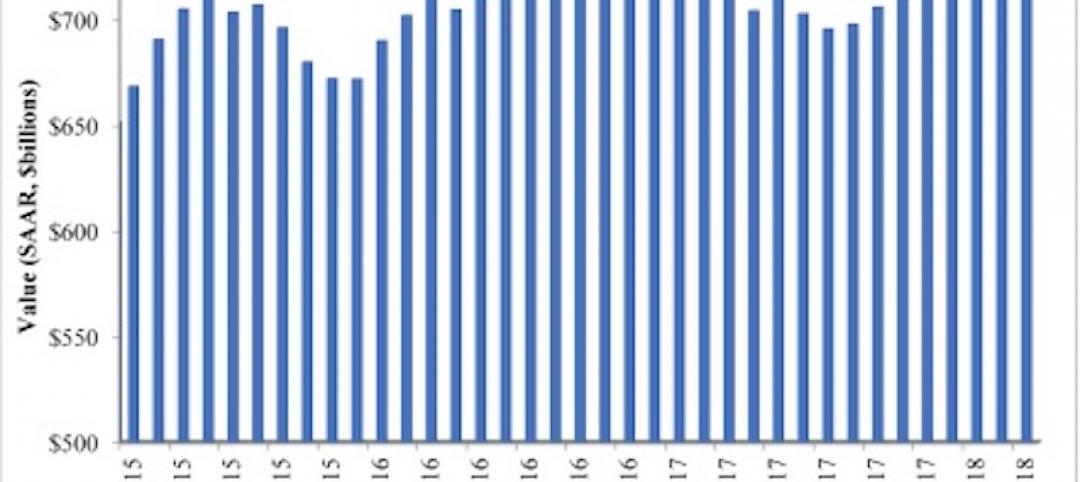
As has been the case a few times this year, the Architecture Billings Index (ABI) dipped in November.
As a leading economic indicator of construction activity, the ABI reflects the approximate nine to twelve month lead time between architecture billings and construction spending. The American Institute of Architects (AIA) reported the November ABI score was 49.3, down from the mark of 53.1 in the previous month. This score reflects a decrease in design services (any score above 50 indicates an increase in billings). The new projects inquiry index was 58.6, up just a nudge from a reading of 58.5 the previous month.
“Since architecture firms continue to report that they are bringing in new projects, this volatility in billings doesn’t seem to reflect any underlying weakness in the construction sector,” said AIA Chief Economist Kermit Baker, Hon. AIA, PhD. “Rather, it could reflect the uncertainty of moving ahead with projects given the continued tightness in construction financing and the growing labor shortage problem gripping the entire design and construction industries.”
Key November ABI highlights:
- Regional averages: South (55.4), West (54.5), Midwest (47.8), Northeast (46.2)
- Sector index breakdown: multi-family residential (53.8), institutional (51.4), commercial / industrial (55.1), mixed practice (54.9)
- Project inquiries index: 58.6
- Design contracts index: 53.5
The regional and sector categories are calculated as a 3-month moving average, whereas the national index, design contracts and inquiries are monthly numbers.
Related Stories

Market Data | May 7, 2018
Construction employers add 17,000 jobs in April and 257,000 for the year
Unemployment rate for construction increases slightly compared to year earlier as higher pay levels appears to be attracting people with recent construction experience back into the workforce.

Market Data | May 2, 2018
Construction employment increases in 245 metro areas between March 2017 & 2018, as trade fights & infrastructure funding shortfalls loom
Houston-The Woodlands-Sugar Land, Texas and Weirton-Steubenville, W.Va.-Ohio experience largest year-over-year gains; Baton Rouge, La. and Auburn-Opelika, Ala. have biggest annual declines.
Market Data | May 2, 2018
Nonresidential Construction down in March, private sector falters, public sector unchanged
February’s spending estimate was revised roughly $10 billion higher.

Market Data | Apr 30, 2018
Outlook mixed for renewable energy installations in Middle East and Africa region
Several major MEA countries are actively supporting the growth of renewable energy.
Market Data | Apr 12, 2018
Construction costs climb in March as wide range of input costs jump
Association officials urge Trump administration, congress to fund infrastructure adequately as better way to stimulate demand than tariffs that impose steep costs on contractors and project owners.

Market Data | Apr 9, 2018
Construction employers add 228,000 jobs over the year despite dip in March
Average hourly earnings increase to $29.43 in construction, topping private sector by nearly 10%; Association officials urge updating and better funding programs to train workers for construction jobs.
Market Data | Apr 4, 2018
Construction employment increases in 257 metro areas between February 2017 & 2018 as construction firms continue to expand amid strong demand
Riverside-San Bernardino-Ontario, Calif. and Merced, Calif. experience largest year-over-year gains; Baton Rouge, La. and Auburn-Opelika, Ala. have biggest annual declines in construction employment.
Market Data | Apr 2, 2018
Construction spending in February inches up from January
Association officials urge federal, state and local officials to work quickly to put recently enacted funding increases to work to improve aging and over-burdened infrastructure, offset public-sector spending drops.

Market Data | Mar 29, 2018
AIA and the University of Minnesota partner to develop Guides for Equitable Practice
The Guides for Equitable Practice will be developed and implemented in three phase.

Market Data | Mar 22, 2018
Architecture billings continue to hold positive in 2018
Billings particularly strong at firms in the West and Midwest regions.


