


As has been the case a few times this year, the Architecture Billings Index (ABI) dipped in November.
As a leading economic indicator of construction activity, the ABI reflects the approximate nine to twelve month lead time between architecture billings and construction spending. The American Institute of Architects (AIA) reported the November ABI score was 49.3, down from the mark of 53.1 in the previous month. This score reflects a decrease in design services (any score above 50 indicates an increase in billings). The new projects inquiry index was 58.6, up just a nudge from a reading of 58.5 the previous month.
“Since architecture firms continue to report that they are bringing in new projects, this volatility in billings doesn’t seem to reflect any underlying weakness in the construction sector,” said AIA Chief Economist Kermit Baker, Hon. AIA, PhD. “Rather, it could reflect the uncertainty of moving ahead with projects given the continued tightness in construction financing and the growing labor shortage problem gripping the entire design and construction industries.”
Key November ABI highlights:
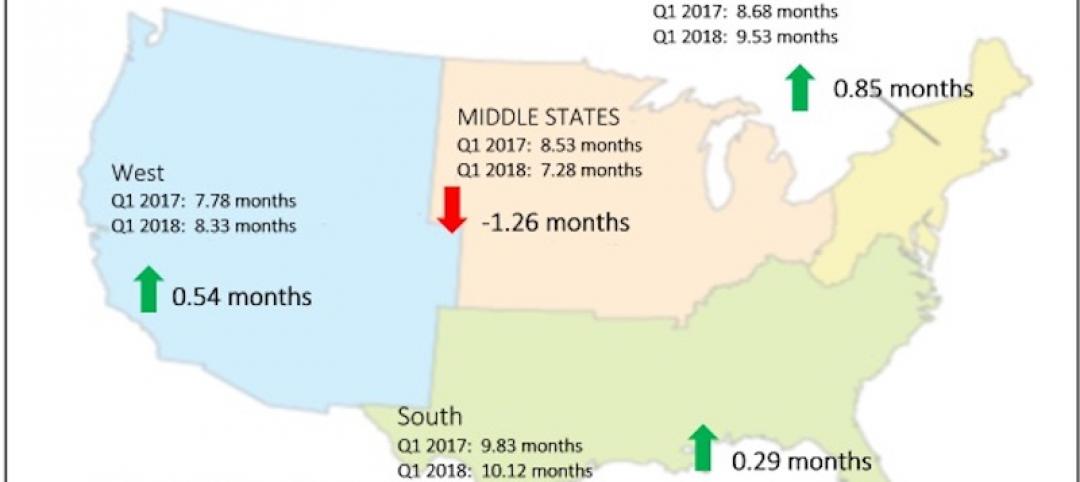
- Regional averages: South (55.4), West (54.5), Midwest (47.8), Northeast (46.2)
- Sector index breakdown: multi-family residential (53.8), institutional (51.4), commercial / industrial (55.1), mixed practice (54.9)
- Project inquiries index: 58.6
- Design contracts index: 53.5
The regional and sector categories are calculated as a 3-month moving average, whereas the national index, design contracts and inquiries are monthly numbers.
Related Stories

Market Data | Jun 26, 2018
Yardi Matrix examines potential regional multifamily supply overload
Outsize development activity in some major metros could increase vacancy rates and stagnate rent growth.

Market Data | Jun 22, 2018
Multifamily market remains healthy – Can it be sustained?
New report says strong economic fundamentals outweigh headwinds.

Market Data | Jun 21, 2018
Architecture firm billings strengthen in May
Architecture Billings Index enters eighth straight month of solid growth.

Market Data | Jun 20, 2018
7% year-over-year growth in the global construction pipeline
There are 5,952 projects/1,115,288 rooms under construction, up 8% by projects YOY.
Market Data | Jun 19, 2018
ABC’s Construction Backlog Indicator remains elevated in first quarter of 2018
The CBI shows highlights by region, industry, and company size.
Market Data | Jun 19, 2018
America’s housing market still falls short of providing affordable shelter to many
The latest report from the Joint Center for Housing Studies laments the paucity of subsidies to relieve cost burdens of ownership and renting.

Market Data | Jun 18, 2018
AI is the path to maximum profitability for retail and FMCG firms
Leading retailers including Amazon, Alibaba, Lowe’s and Tesco are developing their own AI solutions for automation, analytics and robotics use cases.

Market Data | Jun 12, 2018
Yardi Matrix report details industrial sector's strength
E-commerce and biopharmaceutical companies seeking space stoke record performances across key indicators.
Market Data | Jun 8, 2018
Dodge Momentum Index inches up in May
May’s gain was the result of a 4.7% increase by the commercial component of the Momentum Index.
Market Data | Jun 4, 2018
Nonresidential construction remains unchanged in April
Private sector spending increased 0.8% on a monthly basis and is up 5.3% from a year ago.


