


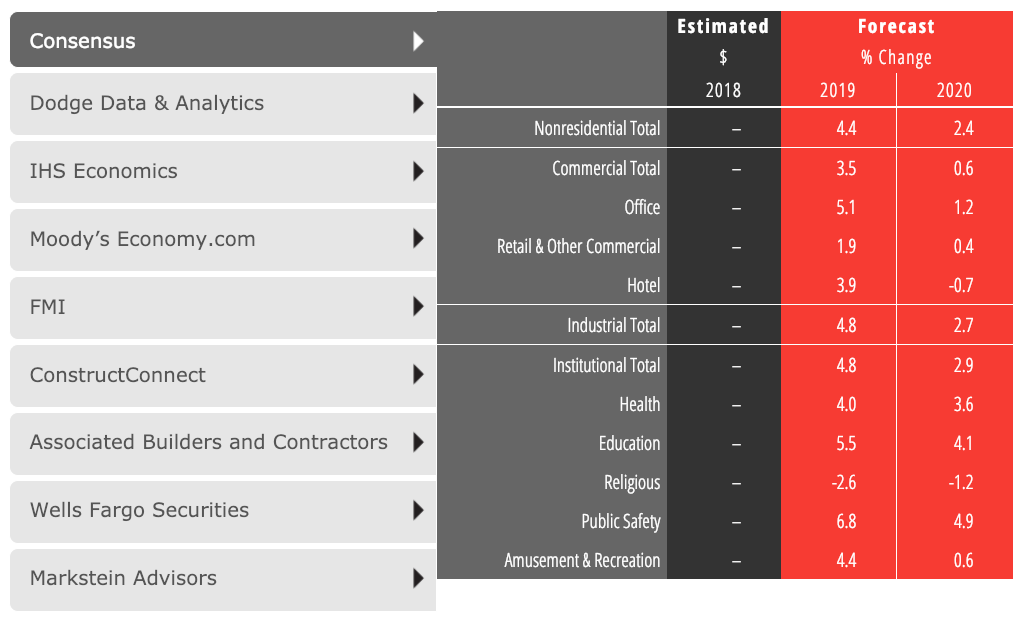
Nonresidential construction spending on buildings is projected to grow by 4.4% through 2019, according to a new consensus forecast from The American Institute of Architects (AIA).
Healthy gains in the industrial and institutional building sectors have bolstered growth projections for 2019. However, the AIA Consensus Construction Forecast Panel—consisting of leading economic forecasters—is suggesting that a broader economic downturn may be materializing over the next 12-24 months. See what each panelist forecasts for 2019 below, and using this interactive chart.
“Though the economy has been performing very well recently, trends in business confidence scores are red flags that suggest a slowdown is likely for 2020,” said AIA Chief Economist Kermit Baker, Hon. AIA, PhD. “These signals may be temporary responses to negative short-term conditions, but historically they have preceded a more widespread downturn.”
OVERALL CONSENSUS
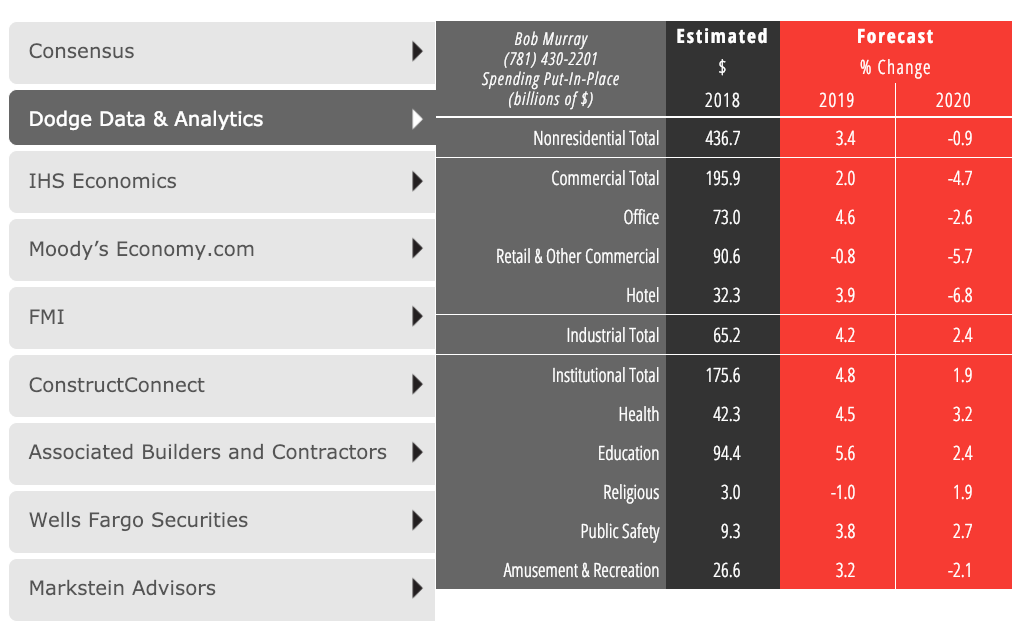
DODGE DATA & ANALYTCS
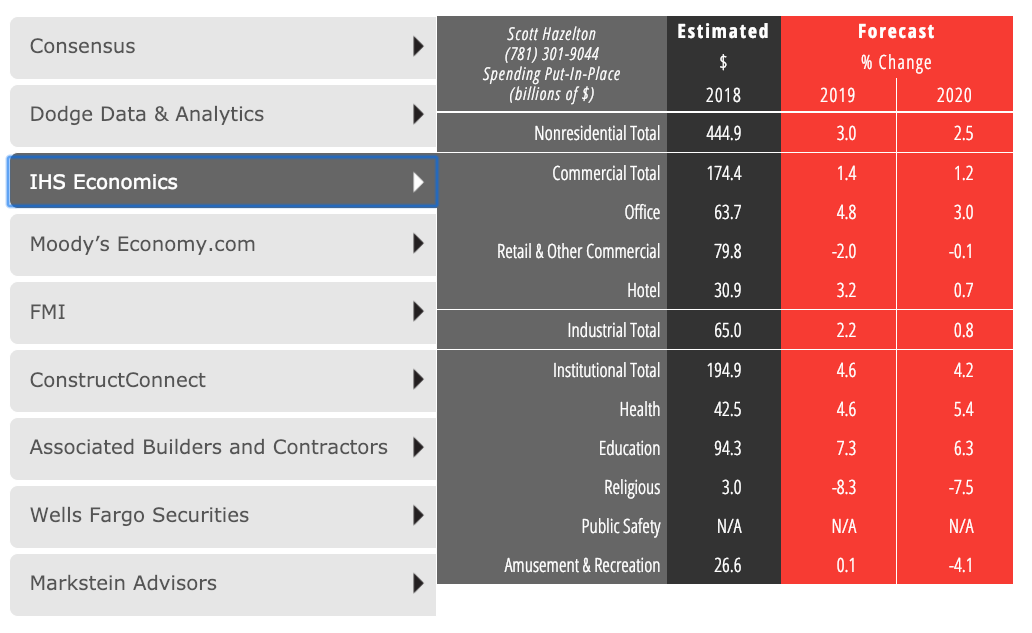
IHS ECONOMICS
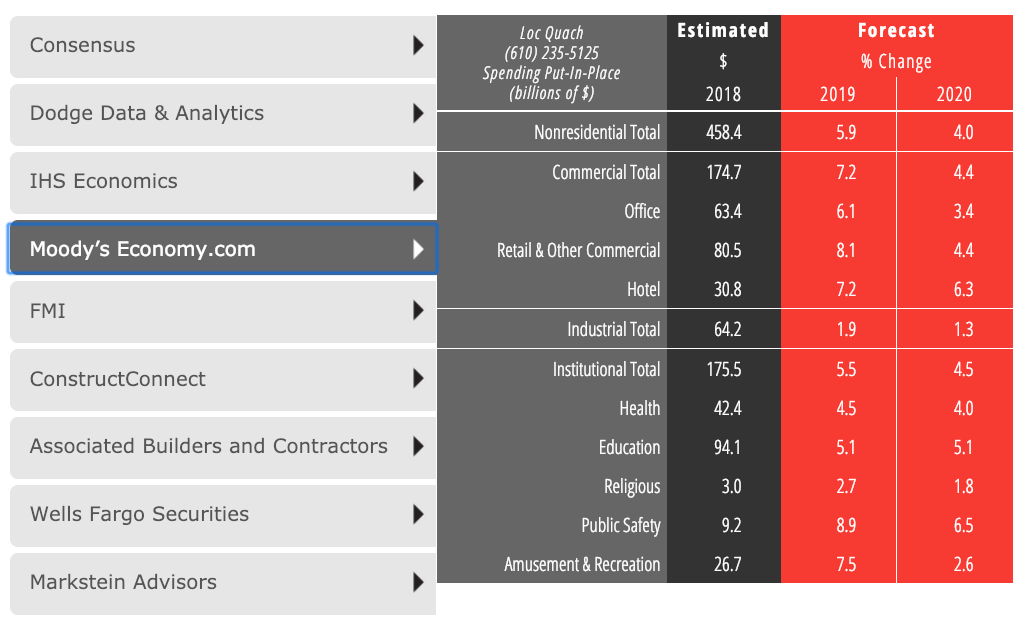
MOODY'S ECONOMY.COM
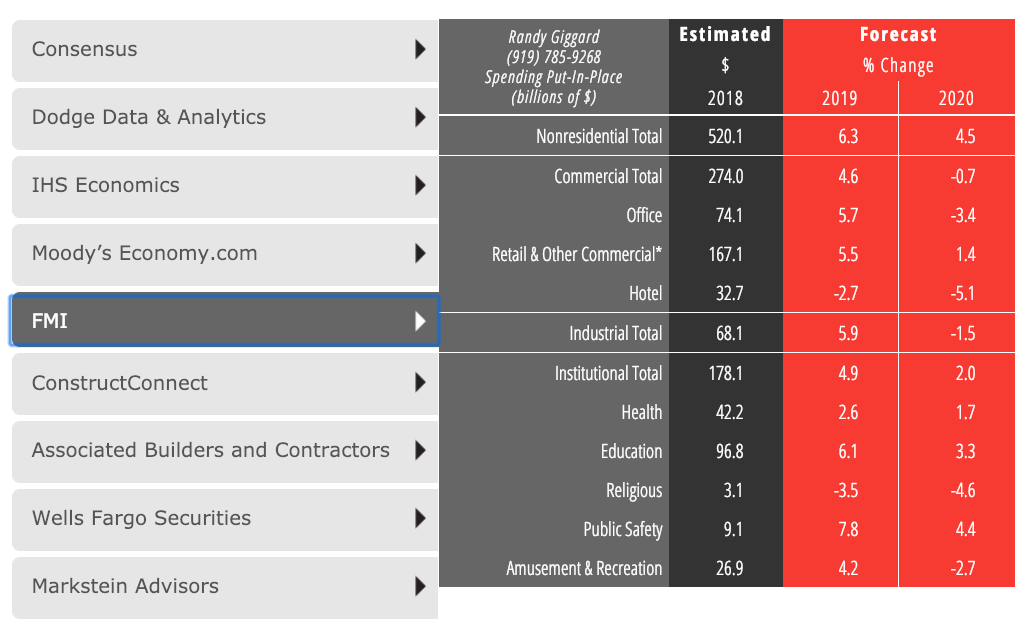
FMI
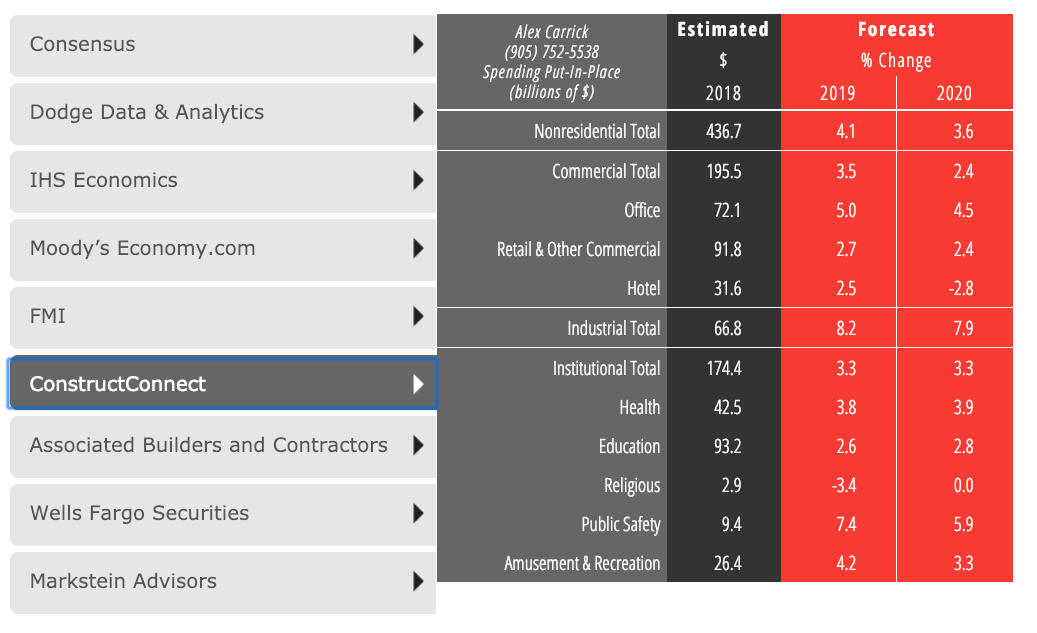
CONSTRUCTCONNECT
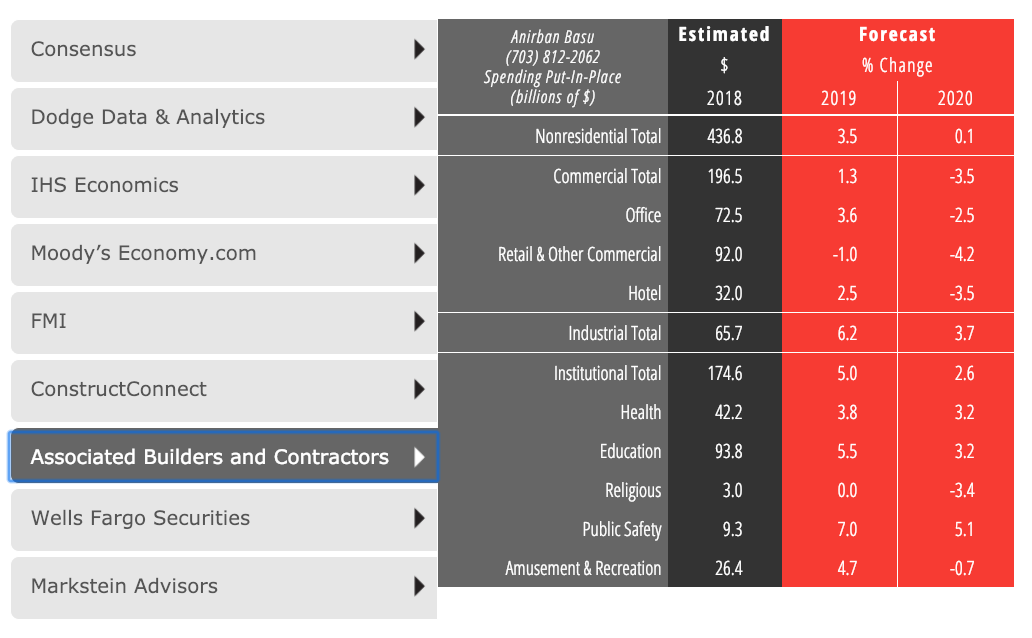
ASSOCIATED BUILDERS AND CONTRACTORS (ABC)
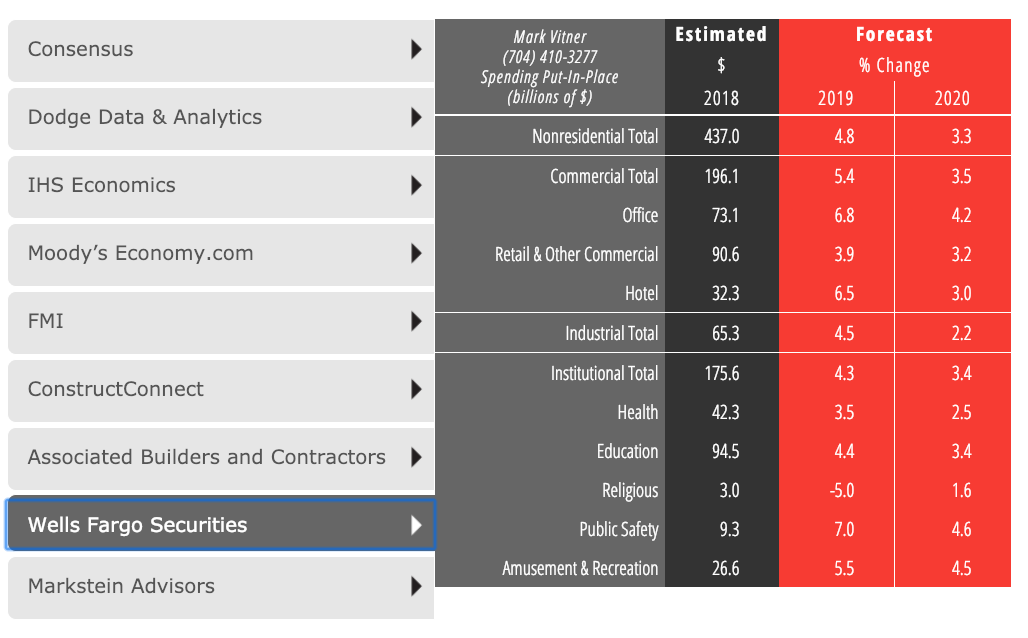
WELLS FARGO SECURITIES
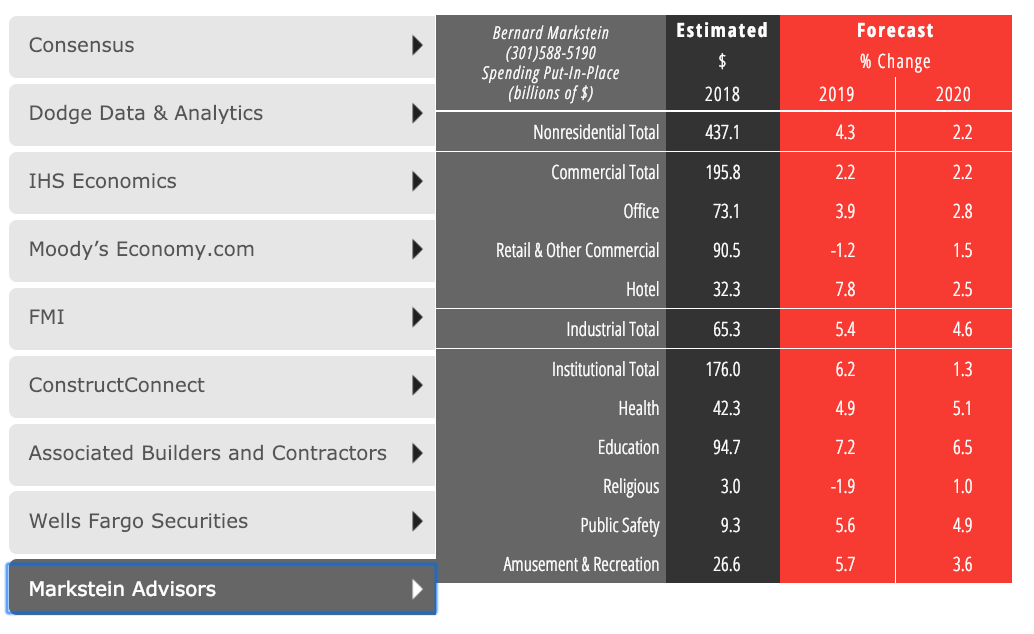
MARKSTEIN ADVISORS
Notes:
• FMI's Retail & Other Commercial category includes transportation and communication sectors.
• The AIA Consensus Forecast is computed as an average of the forecasts provided by the panelists that submit forecasts for each of the included building categories.
• There are no standard definition of some nonresidential building categories, so panelists may define a given category somewhat differently.
• Panelists may forecast only a portion of a category (e.g public buildings but not private buldings); these forecasts are treated like other forecasts in computing the consensus.
• All forecasts are presented in current (non-inflation adjusted) dollars.
Related Stories

Market Data | May 2, 2018
Construction employment increases in 245 metro areas between March 2017 & 2018, as trade fights & infrastructure funding shortfalls loom
Houston-The Woodlands-Sugar Land, Texas and Weirton-Steubenville, W.Va.-Ohio experience largest year-over-year gains; Baton Rouge, La. and Auburn-Opelika, Ala. have biggest annual declines.
Market Data | May 2, 2018
Nonresidential Construction down in March, private sector falters, public sector unchanged
February’s spending estimate was revised roughly $10 billion higher.

Market Data | Apr 30, 2018
Outlook mixed for renewable energy installations in Middle East and Africa region
Several major MEA countries are actively supporting the growth of renewable energy.
Market Data | Apr 12, 2018
Construction costs climb in March as wide range of input costs jump
Association officials urge Trump administration, congress to fund infrastructure adequately as better way to stimulate demand than tariffs that impose steep costs on contractors and project owners.

Market Data | Apr 9, 2018
Construction employers add 228,000 jobs over the year despite dip in March
Average hourly earnings increase to $29.43 in construction, topping private sector by nearly 10%; Association officials urge updating and better funding programs to train workers for construction jobs.
Market Data | Apr 4, 2018
Construction employment increases in 257 metro areas between February 2017 & 2018 as construction firms continue to expand amid strong demand
Riverside-San Bernardino-Ontario, Calif. and Merced, Calif. experience largest year-over-year gains; Baton Rouge, La. and Auburn-Opelika, Ala. have biggest annual declines in construction employment.
Market Data | Apr 2, 2018
Construction spending in February inches up from January
Association officials urge federal, state and local officials to work quickly to put recently enacted funding increases to work to improve aging and over-burdened infrastructure, offset public-sector spending drops.

Market Data | Mar 29, 2018
AIA and the University of Minnesota partner to develop Guides for Equitable Practice
The Guides for Equitable Practice will be developed and implemented in three phase.

Market Data | Mar 22, 2018
Architecture billings continue to hold positive in 2018
Billings particularly strong at firms in the West and Midwest regions.

Market Data | Mar 21, 2018
Construction employment increases in 248 metro areas as new metal tariffs threaten future sector job gains
Riverside-San Bernardino-Ontario, Calif., and Merced, Calif., experience largest year-over-year gains; Baton Rouge, La., and Auburn-Opelika, Ala., have biggest annual declines in construction employment.


