


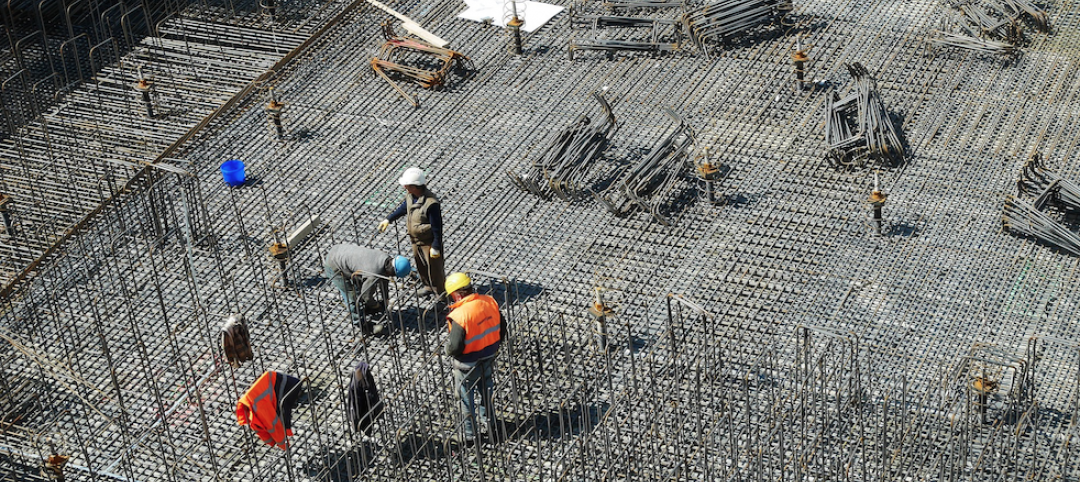
Proposal activity for architecture, engineering and construction (A/E/C) firms increased significantly in the 1st Quarter of 2023, according to PSMJ’s Quarterly Market Forecast (QMF) survey. The predictive measure of the industry’s health rebounded to a net plus/minus index (NPMI) of 32.8 in the first three months of the year. This followed the 8.0 NPMI in the 4th Quarter of 2022, which marked the lowest level since the final quarter of 2020 and the second-lowest NPMI recorded in the last 10 years.
PSMJ President Greg Hart noted that the 1st quarter results are a pleasant surprise, especially since data was collected after the Silicon Valley Bank collapse and amid continuing interest rate hikes and recession predictions. “I don’t think anybody expected this kind of recovery,” he said. “But inflation is cooling and there are some positive signs in the housing market, so maybe we’ve found the bottom.”
First quarter results have historically been the strongest throughout the history of the QMF survey, which may play some part in the jump in project opportunities. In the last 10 years, the first quarter NPMI averaged 45.2, with the results weakening in subsequent quarters. The average NPMI for the 2nd quarter since 2013 is 36.5, with the third and fourth quarters averaging 29.0 and 25.7, respectively. Year-over-year, the NPMI for the first three months of 2023 was down substantially from a near-record NPMI of 60.2 reported in the first quarter of 2022.
PSMJ’s proprietary NPMI is the difference between the percentage of respondents who say that proposal opportunities are growing and those reporting a decrease. In addition to overall activity, the QMF surveys A/E/C firm leaders about their proposal activity experience in 12 major markets and 58 submarkets.
Private Sector Construction Markets Struggle, Publics Thrive
Firms working in private-sector markets continue to report historically low levels of proposal activity, while those in the public sector perform better, as the chart below indicates. Environmental topped all 12 major markets with an NPMI of 71.4, followed by Water/Wastewater at 70.8. Transportation continues to thrive, aided by the Infrastructure Investment and Jobs Act (IIJA), with an NPMI of 65.5. Energy/Utilities remains solid, repeating its fourth-place finish from the prior quarter and a near-exact NPMI of 55.1 (down from 55.2).
Since the 1st quarter of 2019, the Energy/Utilities market has been out of the top five only once (the 2nd quarter of 2021), and the Water/Wastewater market has missed the top five just twice.
The biggest surprise of the 1st Quarter may be that Education was the fifth-strongest among the major markets with an NPMI of 42.2. This is the first time that Education hit the top five since the 2nd quarter of 2018. The Higher Education (NPMI of 45.3) and K-12 (42.3) submarkets drove the resurgence.
Related Stories

Market Data | Jun 14, 2016
Transwestern: Market fundamentals and global stimulus driving economic growth
A new report from commercial real estate firm Transwestern indicates steady progress for the U.S. economy. Consistent job gains, wage growth, and consumer spending have offset declining corporate profits, and global stimulus plans appear to be effective.

Market Data | Jun 7, 2016
Global construction disputes took longer to resolve in 2015
The good news: the length and value of disputes in the U.S. fell last year, according to latest Arcadis report.

Market Data | Jun 3, 2016
JLL report: Retail renovation drives construction growth in 2016
Retail construction projects were up nearly 25% year-over-year, and the industrial and office construction sectors fared well, too. Economic uncertainty looms over everything, however.

Market Data | Jun 2, 2016
ABC: Nonresidential construction spending down in April
Lower building material prices, a sluggish U.S. economy, and hesitation among private developers all factor into the 2.1% drop.

Market Data | May 20, 2016
Report: Urban area population growth slows
Older Millennials are looking to buy homes and move away to more affordable suburbs and exurbs.
Market Data | May 17, 2016
Modest growth for AIA’s Architecture Billings Index in April
The American Institute of Architects reported the April ABI score was 50.6, down from the mark of 51.9 in the previous month. This score still reflects an increase in design services.

Market Data | Apr 29, 2016
ABC: Quarterly GDP growth slowest in two years
Bureau of Economic Analysis data indicates that the U.S. output is barely growing and that nonresidential investment is down.

Market Data | Apr 20, 2016
AIA: Architecture Billings Index ends first quarter on upswing
The multi-family residential sector fared the best. The Midwest was the only U.S. region that didn't see an increase in billings.
Building Technology | Apr 11, 2016
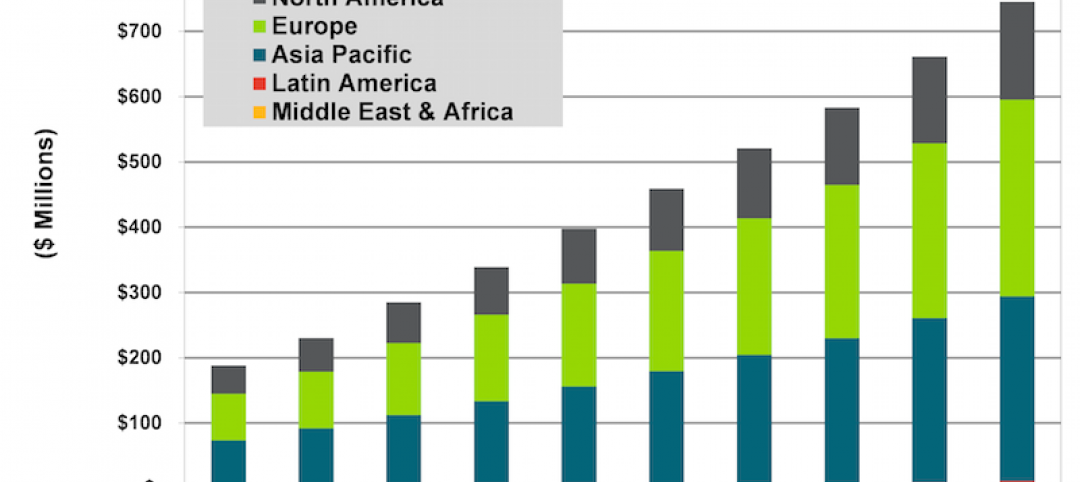
A nascent commercial wireless sensor market is poised to ascend in the next decade
Europe and Asia will propel that growth, according to a new report from Navigant.

Industry Research | Apr 7, 2016
CBRE provides latest insight into healthcare real estate investors’ strategies
Survey respondents are targeting smaller acquisitions, at a time when market cap rates are narrowing for different product types.


