

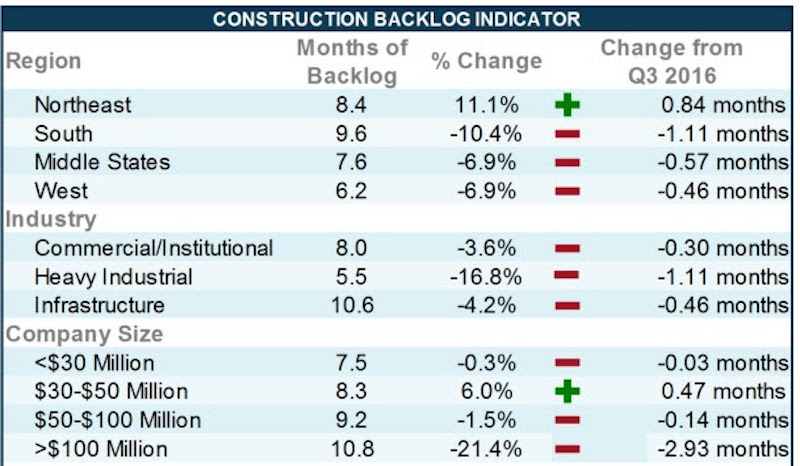
Construction backlog fell by 4 percent during the last quarter of 2016, according to the latest Construction Backlog Indicator (CBI) released today by Associated Builders and Contractors (ABC). Contractors in each segment surveyed—commercial/institutional, infrastructure and heavy industrial—all saw lower backlog during the fourth quarter, with firms in the heavy industrial segment experiencing the largest drop, down 16.8 percent to an average backlog of 5.5 months.
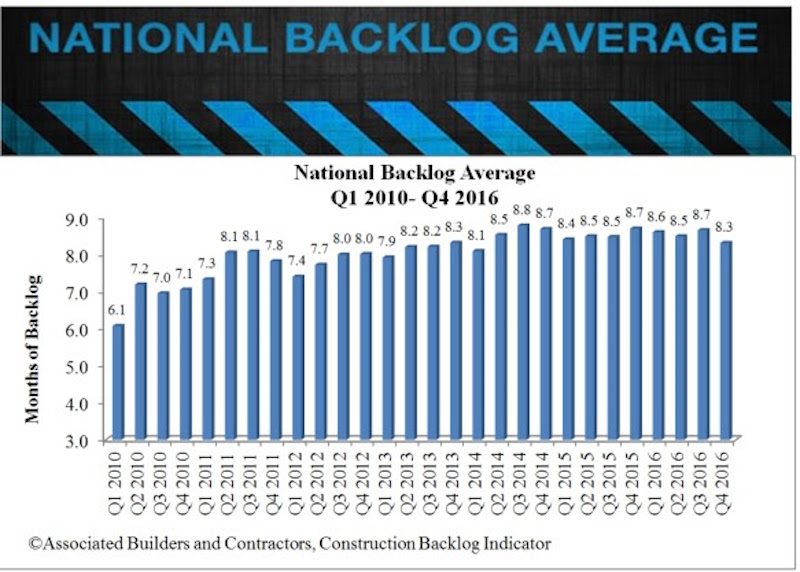
Overall, backlog—the amount of work under contract but yet to be performed—fell to 8.3 months during the fourth quarter. CBI rose a modest 0.4 months or 4.5 percent on a year-over-year basis.
“Many factors contributed to the dip in contractors’ backlog, but none is more important than the lack of public construction spending momentum,” said ABC Chief Economist Anirban Basu. “Indeed, backlog among firms specializing in infrastructure has declined from 12.2 months during the final three months of 2015 to 10.6 months one year later.
“CBI is intended to be a predictive tool and has accurately predicted declining public spending for several quarters,” said Basu. “Recent construction spending data supplied by the U.S. Census Bureau confirm these declines. For instance, between January 2016 and January 2017, construction spending in the nation’s highway and street segment declined by more than 10 percent. In the water supply, public safety and transportation components, the level of construction spending declined by closer to 11 percent. In the sewage and waste disposal category, construction spending declined by a whopping 28 percent.
“A still fragile global economy, strong U.S. dollar, and stubbornly low energy prices have helped to translate into declining heavy industrial backlog,” said Basu. “The only category experiencing construction spending stability is the commercial segment. Over the past year, construction spending in office, lodging and relative categories has surged. During that same period, the CBI reading in the commercial/institutional category has remained stable.”
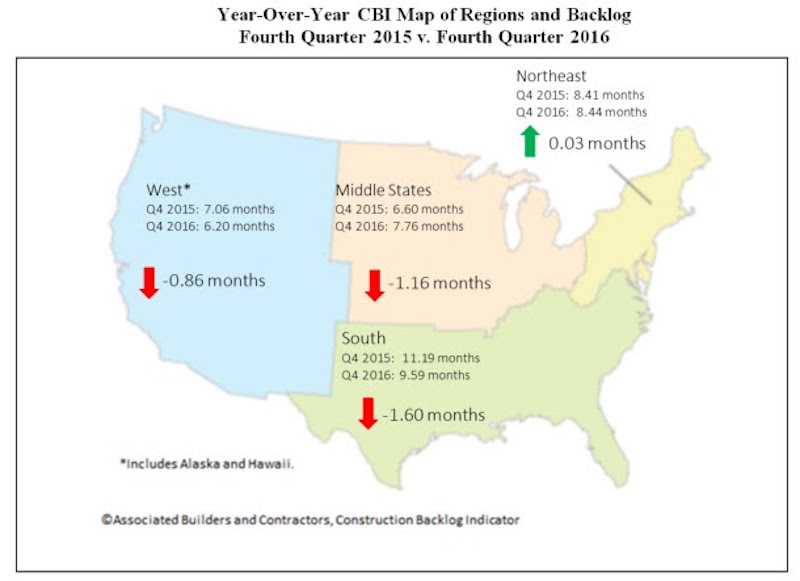
Regional Highlights
- Backlog declined in all major regions of the nation during 2016’s final quarter with the exception of the Northeast. A surge in financial activity and foreign investment in commercial real estate helped buoy construction in the New York metropolitan area, according to available CBI survey data. Boston continues to be propelled by its large and expanding technology sector. Stable economies in both Washington and Baltimore have also helped to drive Northeast CBI higher.
- Middle States backlog sits at roughly 7.8 months. Though this represents a decline on a quarterly basis, backlog is still more than a month higher than it was a year ago. Stable-to-rising industrial production in a number of Middle States communities has helped.
- Backlog in the West declined during the fourth quarter and is now at its lowest level since the first quarter of 2015. The region’s backlog has now fallen in four of the previous five quarters, largely due to dynamics among large construction firms. The technology boom in many communities, including in Silicon Valley and Seattle, has led to massive construction projects in recent years. It was expected that this level of technology-generated construction would slow a bit, and this appears to be what has transpired.
- Backlog in the South fell during 2016’s final quarter, ending a prolonged period of growth that began during the third quarter of 2015. Despite this setback, backlog in the southern region remains elevated due to the volume of construction in several of the region’s most economically dynamic major metropolitan areas, including Dallas, Atlanta, Orlando and Miami.

Highlights by Industry
- Foreign and domestic equity capital, searching for a satisfactory combination of safety and yield, has continued to flow into U.S. commercial real estate.
- Average backlog in the heavy industrial category fell to 5.5 months during the fourth quarter, a decrease of more than 1 month. Backlog in the segment has reverted to early-2014 levels, almost 2 months later than its peak in the second quarter of 2016.
- Backlog in the infrastructure category contracted in the fourth quarter but remains well above its post-recession trough. Despite falling 13.2 percent from the same time last year, backlog in the sector is up 49.8 percent from the fourth quarter of 2013.
- Commercial/institutional backlog fell to end 2016, but the sector remains remarkably stable. The category’s backlog reading has hovered between 8 months and 8.3 months for the past two years.
Company Size Trends
- Backlog for firms with annual revenues above $100 million fell dramatically to end 2016 with contractors shedding nearly three months of backlog on average, dropping from 13.7 months to 10.8 months. The CBI reading for this group is now at its lowest level since the second quarter of 2015.
- Backlog for the smallest firms surveyed—those with annual revenues less than $30 million—remains stable. Many of these companies are subcontractors that continue to toil on privately-financed, commercial construction projects.
- Firms with annual revenues between $30 million and $50 million per annum were in the only category that collectively reported rising backlog. These firms are often advantageously positioned to take on large components of commercial or institutional work, and backlog for this group now stands at a still-healthy 8.3 months.
- Backlog among firms with between $50 million and $100 million in annual revenue fell fractionally during the final quarter, not enough for statistical significance. Though backlog has declined relative to the peak achieved in mid-2013, in part due to the loss of public infrastructure spending momentum, average backlog remains above 9 months.
Click here to view additional charts and graphs.
Related Stories

Codes and Standards | Oct 26, 2022
‘Landmark study’ offers key recommendations for design-build delivery
The ACEC Research Institute and the University of Colorado Boulder released what the White House called a “landmark study” on the design-build delivery method.

Building Team | Oct 26, 2022
The U.S. hotel construction pipeline shows positive growth year-over-year at Q3 2022 close
According to the third quarter Construction Pipeline Trend Report for the United States from Lodging Econometrics (LE), the U.S. construction pipeline stands at 5,317 projects/629,489 rooms, up 10% by projects and 6% rooms Year-Over-Year (YOY).

Designers | Oct 19, 2022
Architecture Billings Index moderates but remains healthy
For the twentieth consecutive month architecture firms reported increasing demand for design services in September, according to a new report today from The American Institute of Architects (AIA).

Market Data | Oct 17, 2022
Calling all AEC professionals! BD+C editors need your expertise for our 2023 market forecast survey
The BD+C editorial team needs your help with an important research project. We are conducting research to understand the current state of the U.S. design and construction industry.

Market Data | Oct 14, 2022
ABC’s Construction Backlog Indicator Jumps in September; Contractor Confidence Remains Steady
Associated Builders and Contractors reports today that its Construction Backlog Indicator increased to 9.0 months in September, according to an ABC member survey conducted Sept. 20 to Oct. 5.

Market Data | Oct 12, 2022
ABC: Construction Input Prices Inched Down in September; Up 41% Since February 2020
Construction input prices dipped 0.1% in September compared to the previous month, according to an Associated Builders and Contractors analysis of U.S. Bureau of Labor Statistics’ Producer Price Index data released today.

Laboratories | Oct 5, 2022
Bigger is better for a maturing life sciences sector
CRB's latest report predicts more diversification and vertical integration in research and production.

Market Data | Aug 25, 2022
‘Disruptions’ will moderate construction spending through next year
JLL’s latest outlook predicts continued pricing volatility due to shortages in materials and labor

Market Data | Aug 2, 2022
Nonresidential construction spending falls 0.5% in June, says ABC
National nonresidential construction spending was down by 0.5% in June, according to an Associated Builders and Contractors analysis of data published today by the U.S. Census Bureau.

Market Data | Jul 28, 2022
The latest Beck Group report sees earlier project collaboration as one way out of the inflation/supply chain malaise
In the first six months of 2022, quarter-to-quarter inflation for construction materials showed signs of easing, but only slightly.


