

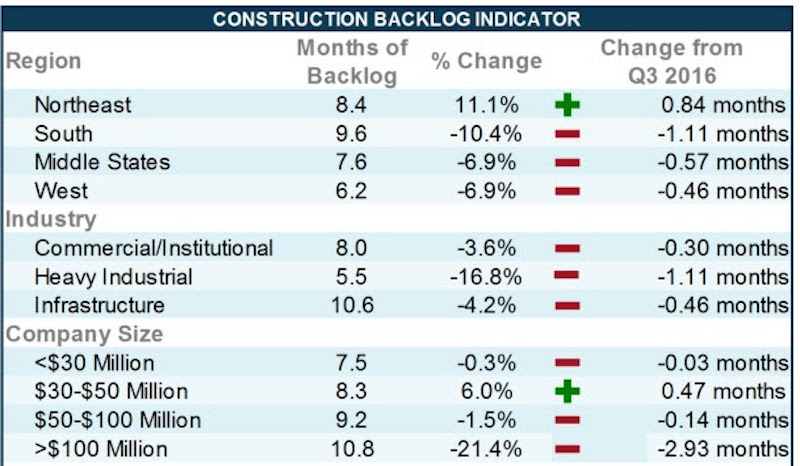
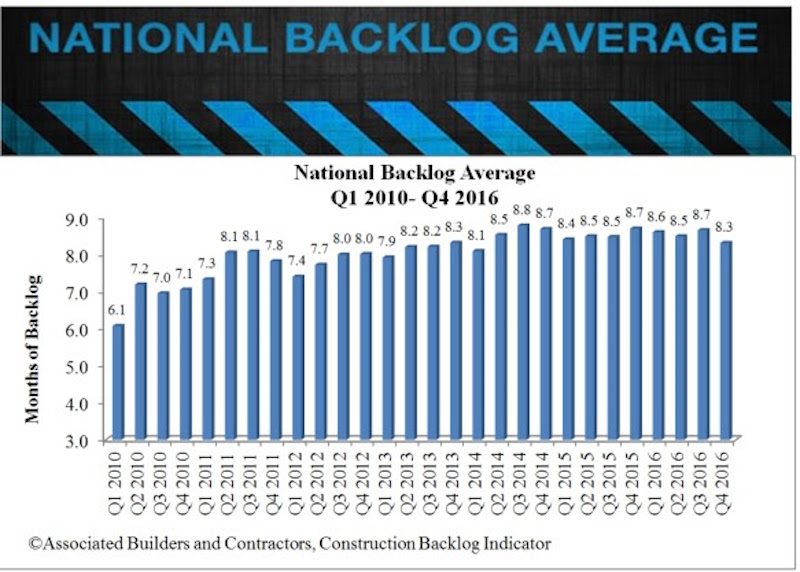
Construction backlog fell by 4 percent during the last quarter of 2016, according to the latest Construction Backlog Indicator (CBI) released today by Associated Builders and Contractors (ABC). Contractors in each segment surveyed—commercial/institutional, infrastructure and heavy industrial—all saw lower backlog during the fourth quarter, with firms in the heavy industrial segment experiencing the largest drop, down 16.8 percent to an average backlog of 5.5 months.
Overall, backlog—the amount of work under contract but yet to be performed—fell to 8.3 months during the fourth quarter. CBI rose a modest 0.4 months or 4.5 percent on a year-over-year basis.
“Many factors contributed to the dip in contractors’ backlog, but none is more important than the lack of public construction spending momentum,” said ABC Chief Economist Anirban Basu. “Indeed, backlog among firms specializing in infrastructure has declined from 12.2 months during the final three months of 2015 to 10.6 months one year later.
“CBI is intended to be a predictive tool and has accurately predicted declining public spending for several quarters,” said Basu. “Recent construction spending data supplied by the U.S. Census Bureau confirm these declines. For instance, between January 2016 and January 2017, construction spending in the nation’s highway and street segment declined by more than 10 percent. In the water supply, public safety and transportation components, the level of construction spending declined by closer to 11 percent. In the sewage and waste disposal category, construction spending declined by a whopping 28 percent.
“A still fragile global economy, strong U.S. dollar, and stubbornly low energy prices have helped to translate into declining heavy industrial backlog,” said Basu. “The only category experiencing construction spending stability is the commercial segment. Over the past year, construction spending in office, lodging and relative categories has surged. During that same period, the CBI reading in the commercial/institutional category has remained stable.”
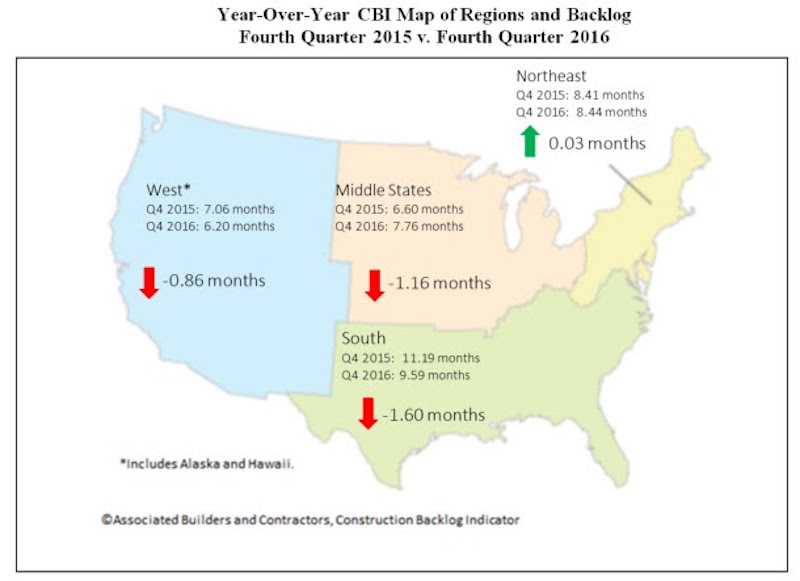
Regional Highlights
- Backlog declined in all major regions of the nation during 2016’s final quarter with the exception of the Northeast. A surge in financial activity and foreign investment in commercial real estate helped buoy construction in the New York metropolitan area, according to available CBI survey data. Boston continues to be propelled by its large and expanding technology sector. Stable economies in both Washington and Baltimore have also helped to drive Northeast CBI higher.
- Middle States backlog sits at roughly 7.8 months. Though this represents a decline on a quarterly basis, backlog is still more than a month higher than it was a year ago. Stable-to-rising industrial production in a number of Middle States communities has helped.
- Backlog in the West declined during the fourth quarter and is now at its lowest level since the first quarter of 2015. The region’s backlog has now fallen in four of the previous five quarters, largely due to dynamics among large construction firms. The technology boom in many communities, including in Silicon Valley and Seattle, has led to massive construction projects in recent years. It was expected that this level of technology-generated construction would slow a bit, and this appears to be what has transpired.
- Backlog in the South fell during 2016’s final quarter, ending a prolonged period of growth that began during the third quarter of 2015. Despite this setback, backlog in the southern region remains elevated due to the volume of construction in several of the region’s most economically dynamic major metropolitan areas, including Dallas, Atlanta, Orlando and Miami.

Highlights by Industry
- Foreign and domestic equity capital, searching for a satisfactory combination of safety and yield, has continued to flow into U.S. commercial real estate.
- Average backlog in the heavy industrial category fell to 5.5 months during the fourth quarter, a decrease of more than 1 month. Backlog in the segment has reverted to early-2014 levels, almost 2 months later than its peak in the second quarter of 2016.
- Backlog in the infrastructure category contracted in the fourth quarter but remains well above its post-recession trough. Despite falling 13.2 percent from the same time last year, backlog in the sector is up 49.8 percent from the fourth quarter of 2013.
- Commercial/institutional backlog fell to end 2016, but the sector remains remarkably stable. The category’s backlog reading has hovered between 8 months and 8.3 months for the past two years.
Company Size Trends
- Backlog for firms with annual revenues above $100 million fell dramatically to end 2016 with contractors shedding nearly three months of backlog on average, dropping from 13.7 months to 10.8 months. The CBI reading for this group is now at its lowest level since the second quarter of 2015.
- Backlog for the smallest firms surveyed—those with annual revenues less than $30 million—remains stable. Many of these companies are subcontractors that continue to toil on privately-financed, commercial construction projects.
- Firms with annual revenues between $30 million and $50 million per annum were in the only category that collectively reported rising backlog. These firms are often advantageously positioned to take on large components of commercial or institutional work, and backlog for this group now stands at a still-healthy 8.3 months.
- Backlog among firms with between $50 million and $100 million in annual revenue fell fractionally during the final quarter, not enough for statistical significance. Though backlog has declined relative to the peak achieved in mid-2013, in part due to the loss of public infrastructure spending momentum, average backlog remains above 9 months.
Click here to view additional charts and graphs.
Related Stories

Contractors | Feb 14, 2023
The average U.S. contractor has nine months worth of construction work in the pipeline
Associated Builders and Contractors reports today that its Construction Backlog Indicator declined 0.2 months to 9.0 in January, according to an ABC member survey conducted Jan. 20 to Feb. 3. The reading is 1.0 month higher than in January 2022.

Office Buildings | Feb 9, 2023
Post-Covid Manhattan office market rebound gaining momentum
Office workers in Manhattan continue to return to their workplaces in sufficient numbers for many of their employers to maintain or expand their footprint in the city, according to a survey of more than 140 major Manhattan office employers conducted in January by The Partnership for New York City.

Giants 400 | Feb 9, 2023
New Giants 400 download: Get the complete at-a-glance 2022 Giants 400 rankings in Excel
See how your architecture, engineering, or construction firm stacks up against the nation's AEC Giants. For more than 45 years, the editors of Building Design+Construction have surveyed the largest AEC firms in the U.S./Canada to create the annual Giants 400 report. This year, a record 519 firms participated in the Giants 400 report. The final report includes 137 rankings across 25 building sectors and specialty categories.

Multifamily Housing | Feb 7, 2023
Multifamily housing rents flat in January, developers remain optimistic
Multifamily rents were flat in January 2023 as a strong jobs report indicated that fears of a significant economic recession may be overblown. U.S. asking rents averaged $1,701, unchanged from the prior month, according to the latest Yardi Matrix National Multifamily Report.

Market Data | Feb 6, 2023
Nonresidential construction spending dips 0.5% in December 2022
National nonresidential construction spending decreased by 0.5% in December, according to an Associated Builders and Contractors analysis of data published today by the U.S. Census Bureau. On a seasonally adjusted annualized basis, nonresidential spending totaled $943.5 billion for the month.

Architects | Jan 23, 2023
PSMJ report: The fed’s wrecking ball is hitting the private construction sector
Inflation may be starting to show some signs of cooling, but the Fed isn’t backing down anytime soon and the impact is becoming more noticeable in the architecture, engineering, and construction (A/E/C) space. The overall A/E/C outlook continues a downward trend and this is driven largely by the freefall happening in key private-sector markets.

Hotel Facilities | Jan 23, 2023
U.S. hotel construction pipeline up 14% to close out 2022
At the end of 2022’s fourth quarter, the U.S. construction pipeline was up 14% by projects and 12% by rooms year-over-year, according to Lodging Econometrics.

Products and Materials | Jan 18, 2023
Is inflation easing? Construction input prices drop 2.7% in December 2022
Softwood lumber and steel mill products saw the biggest decline among building construction materials, according to the latest U.S. Bureau of Labor Statistics’ Producer Price Index.

Market Data | Jan 10, 2023
Construction backlogs at highest level since Q2 2019, says ABC
Associated Builders and Contractors reports today that its Construction Backlog Indicator remained unchanged at 9.2 months in December 2022, according to an ABC member survey conducted Dec. 20, 2022, to Jan. 5, 2023. The reading is one month higher than in December 2021.

Market Data | Jan 6, 2023
Nonresidential construction spending rises in November 2022
Spending on nonresidential construction work in the U.S. was up 0.9% in November versus the previous month, and 11.8% versus the previous year, according to the U.S. Census Bureau.


