


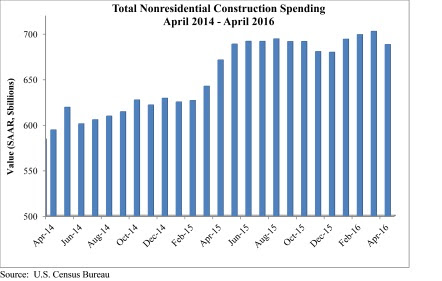
Nonresidential construction spending fell 2.1% in April according to analysis of U.S. Census Bureau data released by Associated Builders and Contractors (ABC). Nonresidential spending totaled $688.2 billion on a seasonally adjusted, annualized rate.
Much like last month, the sting of a disappointing headline number was mitigated by upward revisions to the previous two months of data. March's estimate was revised from $695.7 billion to $702.6 billion, while February's estimate saw a 0.1% increase. March represents the first month in which spending exceeded $700 billion since March 2009.
"Nonresidential construction spending growth continues to struggle to maintain momentum," said ABC Chief Economist Anirban Basu. "The amount of nonresidential construction value put in place has expanded by just 2.5% over the past year, with private spending up 3.4% and public spending up just 1.4%. While many will primarily attribute this to a sluggish U.S. economy, one that has expanded by less than 1.5% during each of the last two completed calendar quarters, there are other factors at work.
"Lower materials prices are embodied in the value of completed work," said Basu. "Though commodity prices have been firming recently, commodity prices had been in decline for more than a year. Moreover, in some communities, nonresidential construction is facing severe constraints given an insufficient number of qualified workers. Both factors would tend to constrain the level of observed growth in nonresidential construction spending.
"There may also be growing skittishness among private developers, who have become increasingly concerned by possible overbuilding in commercial, office and lodging markets," warned Basu. "Both lodging and commercial construction spending dipped in April. This hesitancy is reflected in many ways, including in the Architectural Billings Index, which has struggled to consistently stand meaningfully above its threshold value of 50. Public spending also remains lackluster as many states deal with underfunded pensions and ballooning Medicaid costs."
Only five of 16 nonresidential construction sectors experienced spending increases in April on a monthly basis:
- Religious-related spending expanded 9.6% from March 2016 and 7.3% from April 2015.
- Spending in the public safety category grew 5.2% on a monthly basis but fell 6.2% on a yearly basis.
- Office-related spending expanded 1.6% for the month and 20.3% for the year.
- Amusement and recreation-related spending expanded 0.8% month-over-month and 8.3% year-over-year.
- Spending in the power category rose by 0.3% for the month and 0.6% from April 2015.
Spending in 11 of the nonresidential construction subsectors fell in April on a monthly basis:
- Spending in the communication category fell 7.7% from March 2016 and is down 16.4% from April 2015.
- Highway and street-related spending fell 6.5% on a monthly basis but is up 4% on a yearly basis.
- Commercial-related spending dipped 3.7% for the month but is up 6.8% from April 2015.
- Spending in the health care category fell 3% from March 2016 and is down 0.6% from the same month one year ago.
- Educational-related spending dropped 2.4% month-over-month but is up 5.4% year-over-year.
- Spending in the lodging category fell 2% on a monthly basis but is up 24.6% on a yearly basis.
- Transportation-related spending fell 1.7% since March 2016 and is down 1% from April 2015.
- Sewage and waste disposal-related spending fell 1.4% for the month but is up 1% from April 2015.
- Manufacturing-related spending fell 1.4% month-over-month and 9.8% year-over-year.
- Spending in the conservation and development category dipped 1.2% for the month and 6.5% year-over-year.
- Water supply-related spending fell 0.5% on a monthly basis and 6.5% on a yearly basis.
Related Stories

Market Data | Sep 5, 2023
Nonresidential construction spending increased 0.1% in July 2023
National nonresidential construction spending grew 0.1% in July, according to an Associated Builders and Contractors analysis of data published today by the U.S. Census Bureau. On a seasonally adjusted annualized basis, nonresidential spending totaled $1.08 trillion and is up 16.5% year over year.

Giants 400 | Aug 31, 2023
Top 35 Engineering Architecture Firms for 2023
Jacobs, AECOM, Alfa Tech, Burns & McDonnell, and Ramboll top the rankings of the nation's largest engineering architecture (EA) firms for nonresidential buildings and multifamily buildings work, as reported in Building Design+Construction's 2023 Giants 400 Report.

Giants 400 | Aug 22, 2023
Top 115 Architecture Engineering Firms for 2023
Stantec, HDR, Page, HOK, and Arcadis North America top the rankings of the nation's largest architecture engineering (AE) firms for nonresidential building and multifamily housing work, as reported in Building Design+Construction's 2023 Giants 400 Report.

Giants 400 | Aug 22, 2023
2023 Giants 400 Report: Ranking the nation's largest architecture, engineering, and construction firms
A record 552 AEC firms submitted data for BD+C's 2023 Giants 400 Report. The final report includes 137 rankings across 25 building sectors and specialty categories.

Giants 400 | Aug 22, 2023
Top 175 Architecture Firms for 2023
Gensler, HKS, Perkins&Will, Corgan, and Perkins Eastman top the rankings of the nation's largest architecture firms for nonresidential building and multifamily housing work, as reported in Building Design+Construction's 2023 Giants 400 Report.

Apartments | Aug 22, 2023
Key takeaways from RCLCO's 2023 apartment renter preferences study
Gregg Logan, Managing Director of real estate consulting firm RCLCO, reveals the highlights of RCLCO's new research study, “2023 Rental Consumer Preferences Report.” Logan speaks with BD+C's Robert Cassidy.

Market Data | Aug 18, 2023
Construction soldiers on, despite rising materials and labor costs
Quarterly analyses from Skanska, Mortenson, and Gordian show nonresidential building still subject to materials and labor volatility, and regional disparities.

Apartments | Aug 14, 2023
Yardi Matrix updates near-term multifamily supply forecast
The multifamily housing supply could increase by up to nearly 7% by the end of 2023, states the latest Multifamily Supply Forecast from Yardi Matrix.

Hotel Facilities | Aug 2, 2023
Top 5 markets for hotel construction
According to the United States Construction Pipeline Trend Report by Lodging Econometrics (LE) for Q2 2023, the five markets with the largest hotel construction pipelines are Dallas with a record-high 184 projects/21,501 rooms, Atlanta with 141 projects/17,993 rooms, Phoenix with 119 projects/16,107 rooms, Nashville with 116 projects/15,346 rooms, and Los Angeles with 112 projects/17,797 rooms.

Market Data | Aug 1, 2023
Nonresidential construction spending increases slightly in June
National nonresidential construction spending increased 0.1% in June, according to an Associated Builders and Contractors analysis of data published today by the U.S. Census Bureau. Spending is up 18% over the past 12 months. On a seasonally adjusted annualized basis, nonresidential spending totaled $1.07 trillion in June.


