

Associated Builders and Contractors reported today that its Construction Backlog Indicator contracted to 8.9 months during the fourth quarter of 2018, down 1.1% from the third quarter and 7.5% compared to a year ago. CBI reached a record high of 9.9 months in the second quarter of 2018 and averaged about 9.1 months throughout all four quarters of last year.
CBI is a forward-looking economic indicator that reflects the amount of work that will be performed by U.S. commercial, institutional, industrial and infrastructure construction contractors in the months ahead.
“Though backlog has dipped slightly in the last quarter of 2018, it remains high by historic standards,” said ABC Chief Economist Anirban Basu. “A number of factors contributed to the decline, including a surge in materials prices in early 2018, which likely hindered project planning and contract negotiations later in the year. Interest rates also rose during much of the year, potentially resulting in some projects being postponed or canceled. It is also likely that the feverish market volatility during the fourth quarter of 2018 caused some investors to hold off until the financial marketplace stabilized, which it recently did.
“That said, backlog in the heavy industrial segment rose slightly compared to the third quarter of 2018,” said Basu. “In fact, with industrial production surging for much of last year and with capacity utilization on the rise, the industrial category achieved its highest level in the history of the series during the final quarter of 2019.
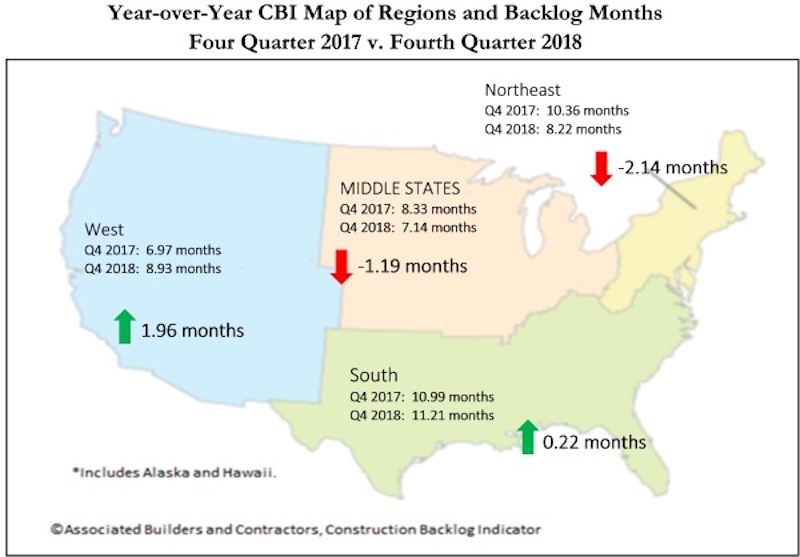
“Backlog in the South expanded at a more rapid pace than in the other three regions during the final quarter of 2018,” said Basu. “This is not altogether surprising—Southern markets like Atlanta; Orlando, Florida; Charlotte, North Carolina; Dallas; and Nashville, Tennessee, are growing significantly. This has much to do with rapid population growth, which naturally creates demand for additional infrastructure. By contrast, the Northeast is hampered by growing concerns regarding overbuilt commercial segments and the Middle States are collectively beginning to feel the effects of an auto production cycle that may have peaked.”
Highlights by Region
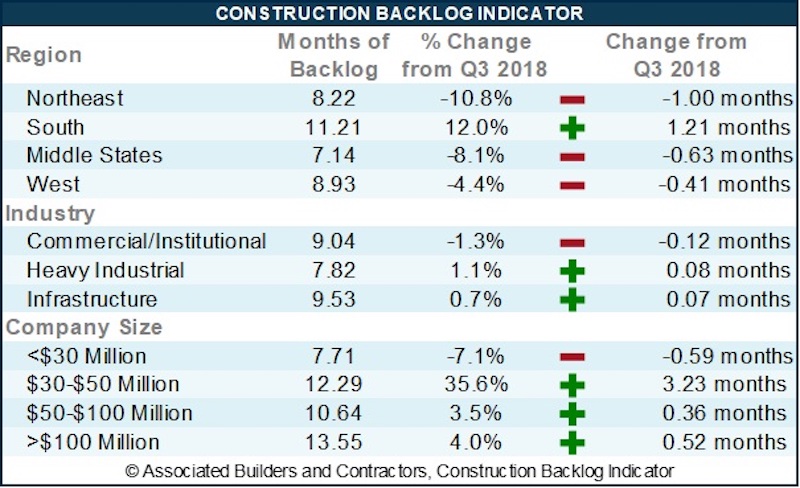
— After decreasing by more than a full month in the third quarter of 2018, backlog in the South bounced back to 11.21 months, the second highest level on record for the region. The South’s backlog remains the highest of the four regions, as has been the case since the fourth quarter of 2014. This is attributable to surging economies in much of the south, including Orlando, Atlanta, Nashville and Dallas.
— Backlog in the Northeast fell by exactly one month from the third quarter of 2018 to the fourth. Backlog is down by more than two months compared to the same time one year ago. There appears to be growing concern that certain segments of commercial real estate are becoming overbuilt, including in the New York, Boston and Washington metropolitan areas. Amazon’s recent HQ2 announcement may help countervail some of these concerns, at least in the Washington metro area.
— Backlog in the Middle States remained between seven and eight months during the entirety of 2018. Still, there has been a gradual pullback in backlog, with the most recent report representing the lowest level of backlog in three years. The Middle States also remain associated with the lowest level of backlog among any region. There is evidence that the auto production and sales cycle has peaked, which has a disproportionate impact on the Middle States.
— Backlog in the West declined on a monthly basis, which could be attributable to the wildfires that ravaged California in November 2018. Regional backlog remains approximately two months higher than during the fourth quarter of 2017 as markets like Phoenix; Los Angeles; San Jose, California; Portland, Oregon; and Seattle continue to experience growth.

Highlights by Industry
— Backlog in the commercial/institutional segment declined by roughly a tenth of a month during the fourth quarter of 2018 and is down 10.2% on a year-over-year basis. Commercial valuations are no longer rising rapidly in much of the nation as capital has become more expensive and global investors appear to have become more defensive. That said, the fourth quarter reading of 9.04 months is well above the industry’s historical average.
— Backlog in the heavy industrial category increased modestly during the fourth quarter of 2018, rising by 0.08 months on a monthly basis. On a yearly basis, the category’s reading increased by an impressive 2.65 months. With capacity utilization rising markedly over the past two years, it is conceivable that backlog in this category will continue to head higher.
— Backlog in the infrastructure category increased by a scant 0.07 months during the fourth quarter and declined significantly during the past year. The lack of faster backlog growth in this category is somewhat surprising, but the combination of ultra-low interest rates and recovering state and local government finances prompted a surge in contracting activity in late 2016 and 2017. In 2018, there was significant growth in infrastructure spending in water, transportation, education and other primarily public-financed categories. Based on the most recent readings, infrastructure spending growth will soften a bit in 2019.

Highlights by Company Size
— Large firms—those with annual revenues in excess of $100 million—experienced gains in backlog totaling more than half a month during 2018’s final quarter. Many of these firms have benefited from large-scale industrial projects planned in Louisiana and other parts of the nation.
— Average backlog among firms with annual revenues between $50 million and $100 million rose by 3.5% during the fourth quarter, unchanged from the same time one year ago. This is consistent with some flattening in commercial/institutional backlog, which serves as a primary source of business for many of these firms.
— Backlog for firms with revenues between $30 million and $50 million has been volatile in recent months, but ended 2018 roughly where it had been at the end of 2015. The current economic expansion has benefited these firms, many of which are specialty trade contractors now in short supply.
— Backlog for firms with annual revenues below $30 million fell to 7.71 months during the fourth quarter, but remains virtually unchanged from the same time a year ago. Backlog among this group has been generally stable over time and there is little to no indication of deterioration.
Related Stories
High-rise Construction | Jan 23, 2017
Growth spurt: A record-breaking 128 buildings of 200 meters or taller were completed in 2016
This marks the third consecutive record-breaking year for building completions over 200 meters.

Market Data | Jan 18, 2017
Fraud and risk incidents on the rise for construction, engineering, and infrastructure businesses
Seven of the 10 executives in the sector surveyed in the report said their company fell victim to fraud in the past year.

Market Data | Jan 18, 2017
Architecture Billings Index ends year on positive note
Architecture firms close 2016 with the strongest performance of the year.
Market Data | Jan 12, 2017
73% of construction firms plan to expand their payrolls in 2017
However, many firms remain worried about the availability of qualified workers.

Market Data | Jan 9, 2017
Trump market impact prompts surge in optimism for U.S. engineering firm leaders
The boost in firm leader optimism extends across almost the entire engineering marketplace.
Market Data | Jan 5, 2017
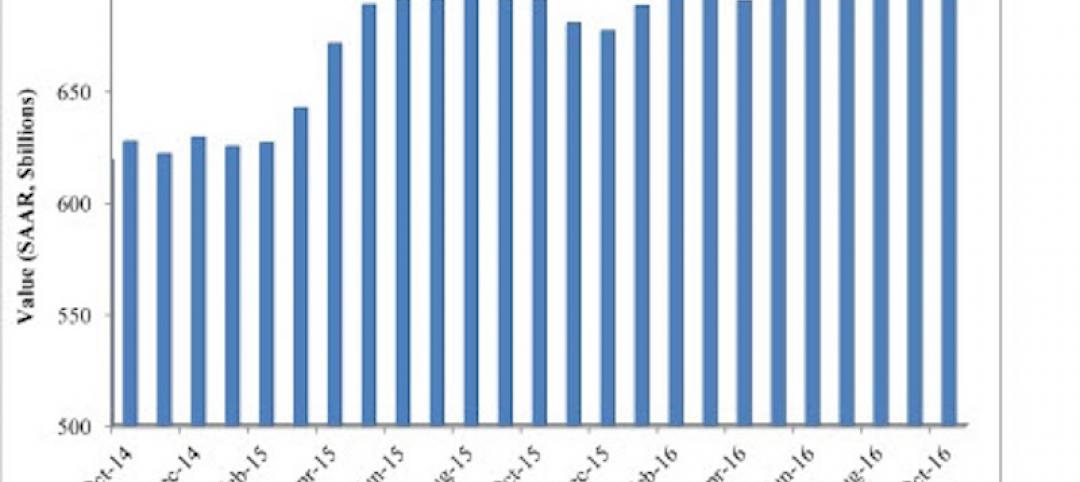
Nonresidential spending thrives in strong November spending report
Many construction firms have reported that they remain busy but have become concerned that work could dry up in certain markets in 2017 or 2018, says Anirban Basu, ABC Chief Economist.

Market Data | Dec 21, 2016
Architecture Billings Index up slightly in November
New design contracts also return to positive levels, signifying future growth in construction activity.
Market Data | Dec 21, 2016
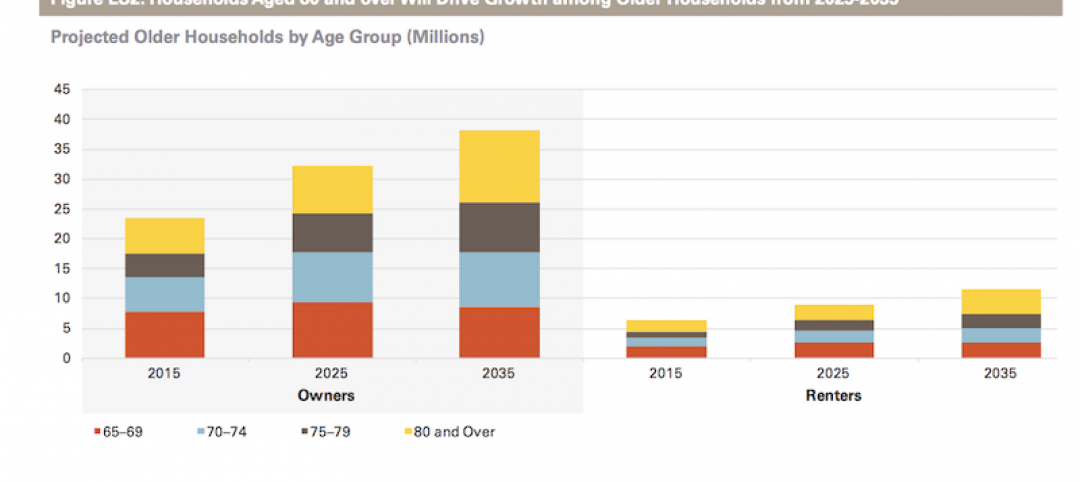
Will housing adjust to an aging population?
New Joint Center report projects 66% increase in senior heads of households by 2035.
Market Data | Dec 13, 2016
ABC predicts modest growth for 2017 nonresidential construction sector; warns of vulnerability for contractor
“The U.S. economy continues to expand amid a weak global economy and, despite risks to the construction industry, nonresidential spending should expand 3.5 percent in 2017,” says ABC Chief Economist Anirban Basu.
Market Data | Dec 2, 2016
Nonresidential construction spending gains momentum
Nonresidential spending is now 2.6 percent higher than at the same time one year ago.


