


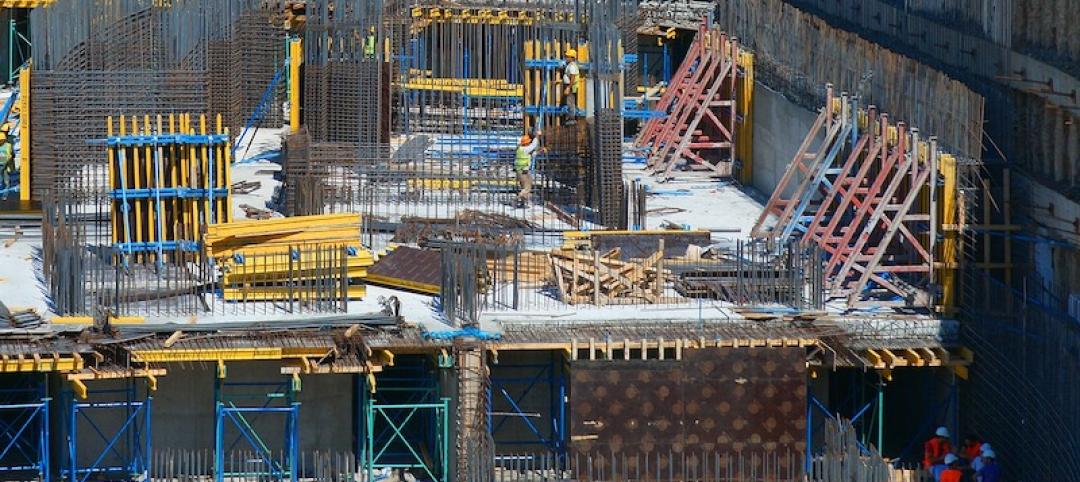
A new market analysis compiled by Yardi® Matrix reports that the industrial sector of the U.S. economy is performing solidly. Warehouse and distribution assets posted double-digit total returns, record low vacancy rates and all-time high rents in 2017 and are on track for an even stronger year in 2018, according to the report.
The report, titled "Hitting Its Stride," details how rising e-commerce sales and online retailers' focus on moving closer to customers have made warehouse space popular with both investors and tenants.
See Also: Yardi Matrix report shows U.S. rent surge in April
Biopharmaceutical companies, whose growth potential and long-term returns have drawn increasing investment attention, are seeking new locations away from such traditional centers as Boston, San Francisco and Seattle. Meanwhile, rising imports, expanded Panama Canal capacity and larger cargo ships have driven up demand for industrial space at U.S. seaports. These and other factors "prompted a number of architects to design [warehouses] upward instead of outward," the report says, and inspired new designs to accommodate direct consumer delivery, refrigeration, vertical development and sustainability.
The report, which can be downloaded here, also includes a Q&A with Jim Connor, chairman and CEO of industrial asset owner and operator Duke Realty Corp.
Related Stories
Market Data | Jun 22, 2021
Architecture billings continue historic rebound
AIA’s Architecture Billings Index (ABI) score for May rose to 58.5 compared to 57.9 in April.
Market Data | Jun 17, 2021
Commercial construction contractors upbeat on outlook despite worsening material shortages, worker shortages
88% indicate difficulty in finding skilled workers; of those, 35% have turned down work because of it.
Market Data | Jun 16, 2021
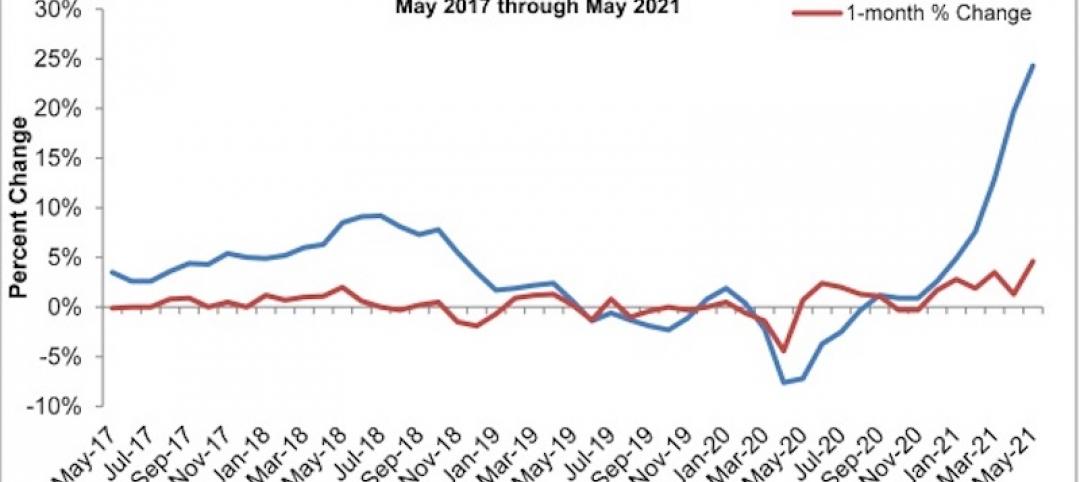
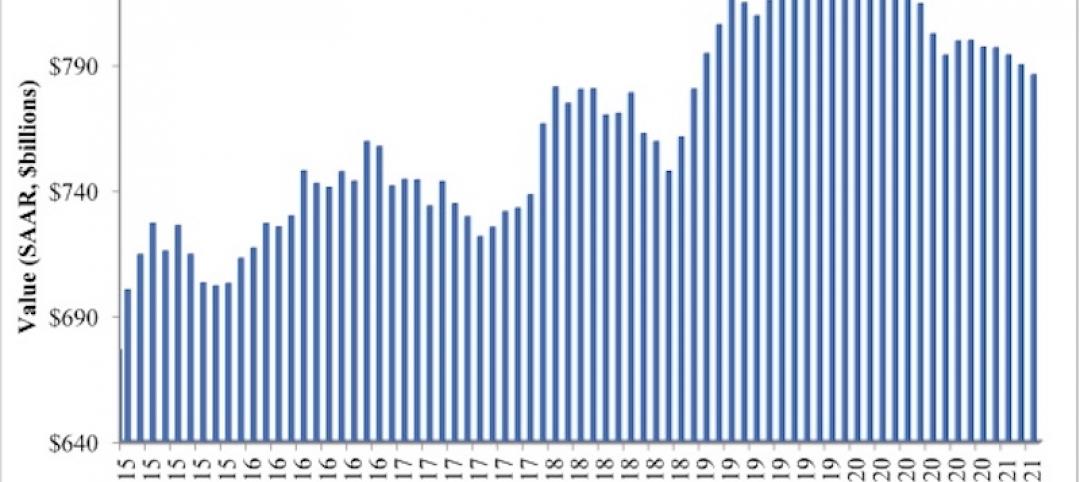
Construction input prices rise 4.6% in May; softwood lumber prices up 154% from a year ago
Construction input prices are 24.3% higher than a year ago, while nonresidential construction input prices increased 23.9% over that span.

Market Data | Jun 16, 2021
Producer prices for construction materials and services jump 24% over 12 months
The 24.3% increase in prices for materials used in construction from May 2020 to last month was nearly twice as great as in any previous year
Market Data | Jun 15, 2021
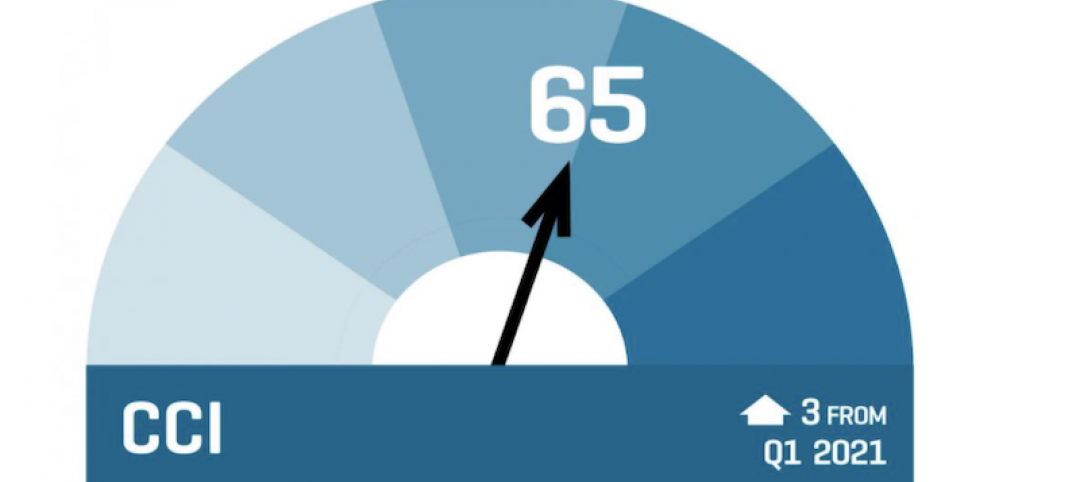
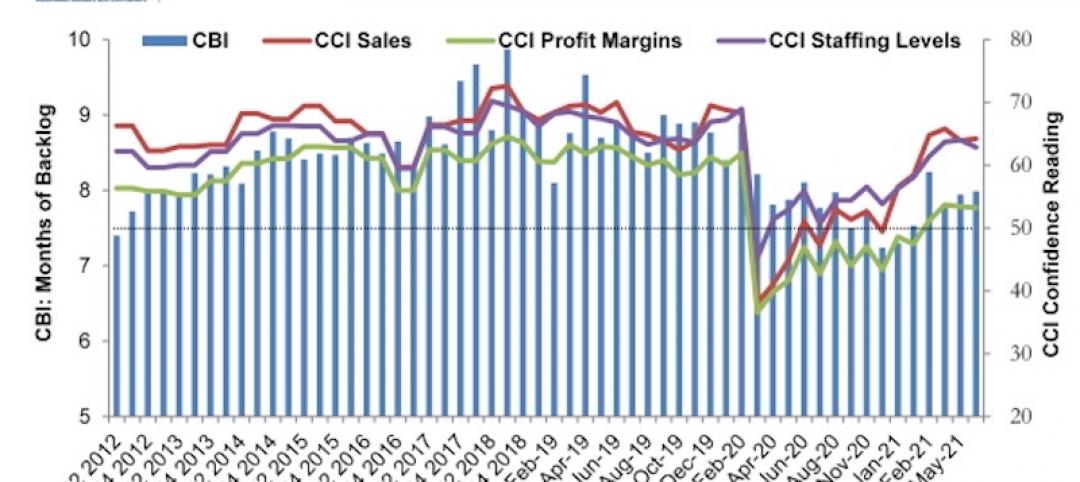
ABC’s Construction Backlog inches higher in May
Materials and labor shortages suppress contractor confidence.

Market Data | Jun 11, 2021
The countries with the most green buildings
As the country that set up the LEED initiative, the US is a natural leader in constructing green buildings.
Market Data | Jun 7, 2021
Construction employment slips by 20,000 in May
Seasonally adjusted construction employment in May totaled 7,423,000.

Market Data | Jun 2, 2021
Construction employment in April lags pre-covid February 2020 level in 107 metro areas
Houston-The Woodlands-Sugar Land and Odessa, Texas have worst 14-month construction job losses.
Market Data | Jun 1, 2021
Nonresidential construction spending decreases 0.5% in April
Spending was down on a monthly basis in nine of 16 nonresidential subcategories.

Market Data | Jun 1, 2021
Nonresidential construction outlays drop in April to two-year low
Public and private work declines amid supply-chain woes, soaring costs.


