A new market analysis compiled by Yardi® Matrix reports that the industrial sector of the U.S. economy is performing solidly. Warehouse and distribution assets posted double-digit total returns, record low vacancy rates and all-time high rents in 2017 and are on track for an even stronger year in 2018, according to the report.
The report, titled "Hitting Its Stride," details how rising e-commerce sales and online retailers' focus on moving closer to customers have made warehouse space popular with both investors and tenants.
See Also: Yardi Matrix report shows U.S. rent surge in April
Biopharmaceutical companies, whose growth potential and long-term returns have drawn increasing investment attention, are seeking new locations away from such traditional centers as Boston, San Francisco and Seattle. Meanwhile, rising imports, expanded Panama Canal capacity and larger cargo ships have driven up demand for industrial space at U.S. seaports. These and other factors "prompted a number of architects to design [warehouses] upward instead of outward," the report says, and inspired new designs to accommodate direct consumer delivery, refrigeration, vertical development and sustainability.
The report, which can be downloaded here, also includes a Q&A with Jim Connor, chairman and CEO of industrial asset owner and operator Duke Realty Corp.
Related Stories
Market Data | Aug 24, 2021
July construction employment lags pre-pandemic peak in 36 states
Delta variant of coronavirus threatens to hold down further gains.
Market Data | Aug 17, 2021
Demand for design activity continues to expand
The ABI score for July was 54.6.
Market Data | Aug 12, 2021
Steep rise in producer prices for construction materials and services continues in July.
The producer price index for new nonresidential construction rose 4.4% over the past 12 months.
Market Data | Aug 6, 2021
Construction industry adds 11,000 jobs in July
Nonresidential sector trails overall recovery.
Market Data | Aug 2, 2021
Nonresidential construction spending falls again in June
The fall was driven by a big drop in funding for highway and street construction and other public work.
Market Data | Jul 29, 2021
Outlook for construction spending improves with the upturn in the economy
The strongest design sector performers for the remainder of this year are expected to be health care facilities.
Market Data | Jul 29, 2021
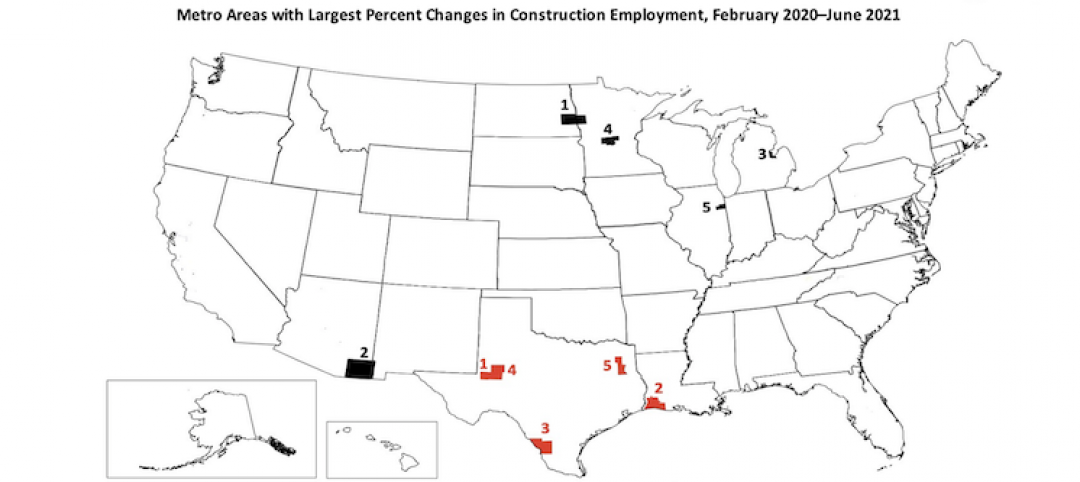
Construction employment lags or matches pre-pandemic level in 101 metro areas despite housing boom
Eighty metro areas had lower construction employment in June 2021 than February 2020.
Market Data | Jul 28, 2021
Marriott has the largest construction pipeline of U.S. franchise companies in Q2‘21
472 new hotels with 59,034 rooms opened across the United States during the first half of 2021.
Market Data | Jul 27, 2021
New York leads the U.S. hotel construction pipeline at the close of Q2‘21
Many hotel owners, developers, and management groups have used the operational downtime, caused by COVID-19’s impact on operating performance, as an opportunity to upgrade and renovate their hotels and/or redefine their hotels with a brand conversion.
Market Data | Jul 26, 2021
U.S. construction pipeline continues along the road to recovery
During the first and second quarters of 2021, the U.S. opened 472 new hotels with 59,034 rooms.


