


A new market analysis compiled by Yardi® Matrix reports that the industrial sector of the U.S. economy is performing solidly. Warehouse and distribution assets posted double-digit total returns, record low vacancy rates and all-time high rents in 2017 and are on track for an even stronger year in 2018, according to the report.
The report, titled "Hitting Its Stride," details how rising e-commerce sales and online retailers' focus on moving closer to customers have made warehouse space popular with both investors and tenants.
See Also: Yardi Matrix report shows U.S. rent surge in April
Biopharmaceutical companies, whose growth potential and long-term returns have drawn increasing investment attention, are seeking new locations away from such traditional centers as Boston, San Francisco and Seattle. Meanwhile, rising imports, expanded Panama Canal capacity and larger cargo ships have driven up demand for industrial space at U.S. seaports. These and other factors "prompted a number of architects to design [warehouses] upward instead of outward," the report says, and inspired new designs to accommodate direct consumer delivery, refrigeration, vertical development and sustainability.
The report, which can be downloaded here, also includes a Q&A with Jim Connor, chairman and CEO of industrial asset owner and operator Duke Realty Corp.
Related Stories
Market Data | Oct 27, 2021
Only 14 states and D.C. added construction jobs since the pandemic began
Supply problems, lack of infrastructure bill undermine recovery.

Market Data | Oct 26, 2021
U.S. construction pipeline experiences highs and lows in the third quarter
Renovation and conversion pipeline activity remains steady at the end of Q3 ‘21, with conversion projects hitting a cyclical peak, and ending the quarter at 752 projects/79,024 rooms.

Market Data | Oct 19, 2021
Demand for design services continues to increase
The Architecture Billings Index (ABI) score for September was 56.6.
Market Data | Oct 14, 2021
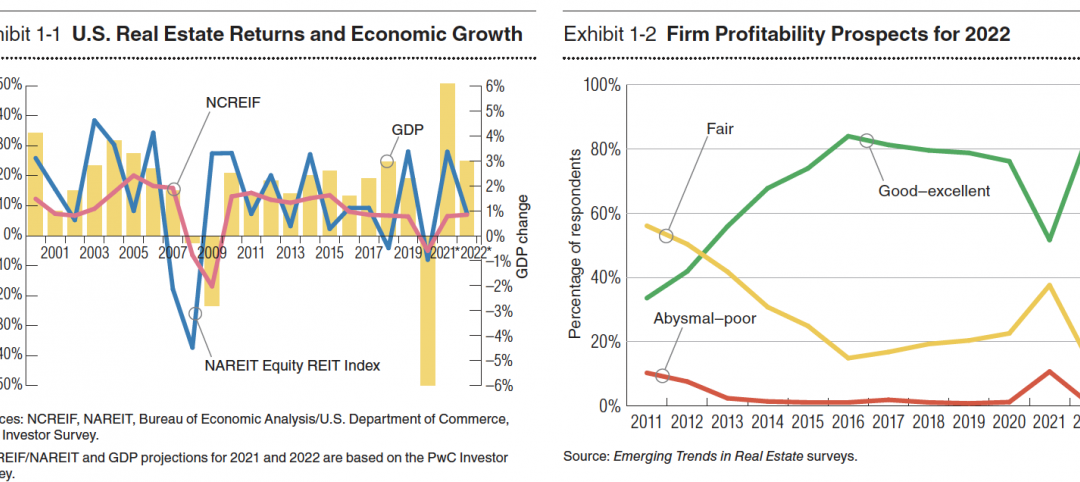
Climate-related risk could be a major headwind for real estate investment
A new trends report from PwC and ULI picks Nashville as the top metro for CRE prospects.
Market Data | Oct 14, 2021
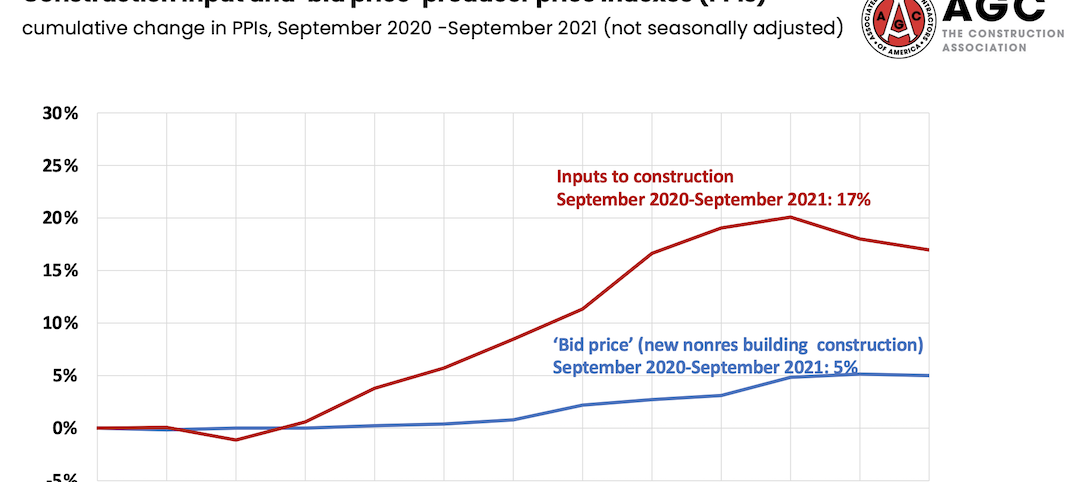
Prices for construction materials continue to outstrip bid prices over 12 months
Construction officials renew push for immediate removal of tariffs on key construction materials.
Market Data | Oct 11, 2021
No decline in construction costs in sight
Construction cost gains are occurring at a time when nonresidential construction spending was down by 9.5 percent for the 12 months through July 2021.
Market Data | Oct 11, 2021
Nonresidential construction sector posts first job gain since March
Has yet to hit pre-pandemic levels amid supply chain disruptions and delays.
Market Data | Oct 4, 2021
Construction spending stalls between July and August
A decrease in nonresidential projects negates ongoing growth in residential work.
Market Data | Oct 1, 2021
Nonresidential construction spending dips in August
Spending declined on a monthly basis in 10 of the 16 nonresidential subcategories.
Market Data | Sep 29, 2021
One-third of metro areas lost construction jobs between August 2020 and 2021
Lawrence-Methuen Town-Salem, Mass. and San Diego-Carlsbad, Calif. top lists of metros with year-over-year employment increases.


