


Rents in most American cities continue to rise slightly each month, but are not duplicating the rapid escalation rates exhibited in 2021. But given ongoing gains, Yardi® Matrix has revised its end-of-year projections upwards for most markets in a new special report.
Average month-over-month asking rents increased by 1.1 percent in May compared to the one percent month-over-month increase in April. However, year-over-year asking rents decelerated, from 16 percent in April to 14 percent in May.
“While we are seeing the usual seasonal increase leading into the summer months, 2022 does not look like a repeat of 2021 even though rent growth remains elevated,” state Matrix analysts.
Asking rents fell in only six markets: the gateway markets of Queens and Brooklyn; small Southern markets Macon, Ga., and Jackson, Miss.; and tropical Honolulu and the Southwest Florida Coast.
Conversely, 84 markets experienced greater than one percent month-over-month increase, and seven markets saw month-over-month growth that topped two percent: Charleston, Knoxville, the Bay Area-South Bay, Miami, the Urban Twin Cities, Wilmington, N.C., and Portland, Maine.
Most markets received an increase to their end-of-year projections in the newly released Matrix report. The biggest increases were concentrated in markets that continue to outperform expectations, with Scranton-Wilkes-Barre, Wilmington, South Bend and Spokane all seeing a more than five percent increase for year-end 2022.
Learn more about the expectations for rents for the remainder of 2022.
Yardi Matrix offers the industry’s most comprehensive market intelligence tool for investment professionals, equity investors, lenders and property managers who underwrite and manage investments in commercial real estate. Yardi Matrix covers multifamily, student housing, industrial, office and self storage property types. Email matrix@yardi.com, call 480-663-1149 or visit yardimatrix.com to learn more.
Related Stories

Market Data | Dec 13, 2017
Top world regions and markets in the global hotel construction pipeline
The top world region by project count is North America.

Market Data | Dec 11, 2017
Global hotel construction pipeline is growing
The Total Pipeline stands at 12,427 Projects/2,084,940 Rooms.
Market Data | Dec 11, 2017
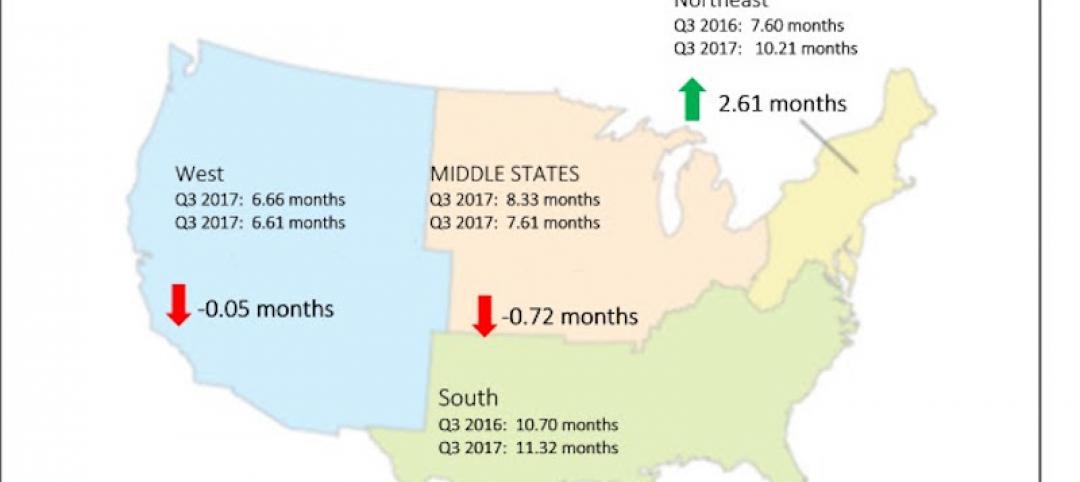
Construction backlog surges, sets record in third quarter
CBI is a leading economic indicator that reflects the amount of construction work under contract, but not yet completed.
Market Data | Dec 7, 2017
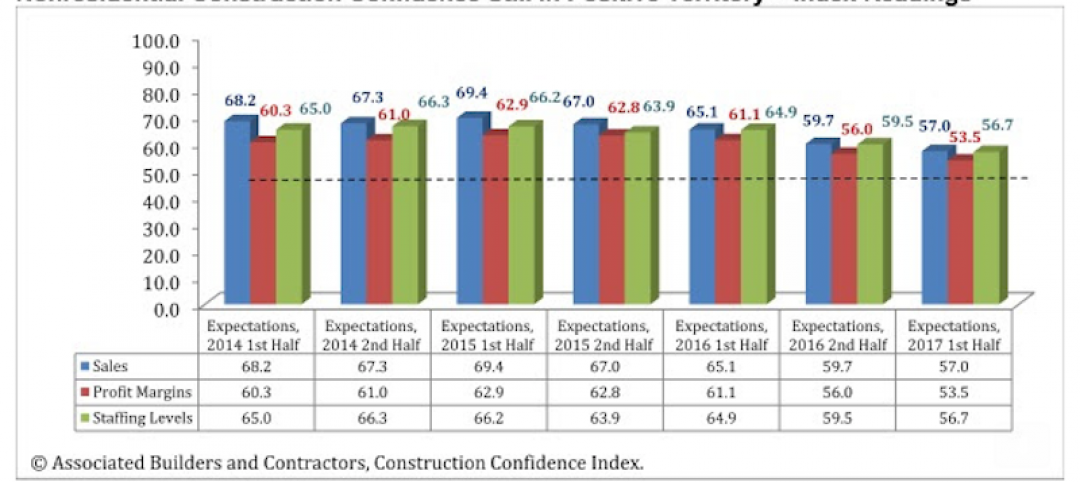
Buoyed by healthy economy, ABC Index finds contractors upbeat
Despite rising construction labor and materials costs, 55% of contractors expect their profit margins to expand in the first half of 2018.

Market Data | Dec 5, 2017
Top health systems engaged in $21 billion of U.S. construction projects
Largest active projects are by Sutter Health, New York Presbyterian, and Scripps Health.

Industry Research | Nov 28, 2017
2018 outlook: Economists point to slowdown, AEC professionals say ‘no way’
Multifamily housing and senior living developments head the list of the hottest sectors heading into 2018, according a survey of 356 AEC professionals.
Market Data | Nov 27, 2017
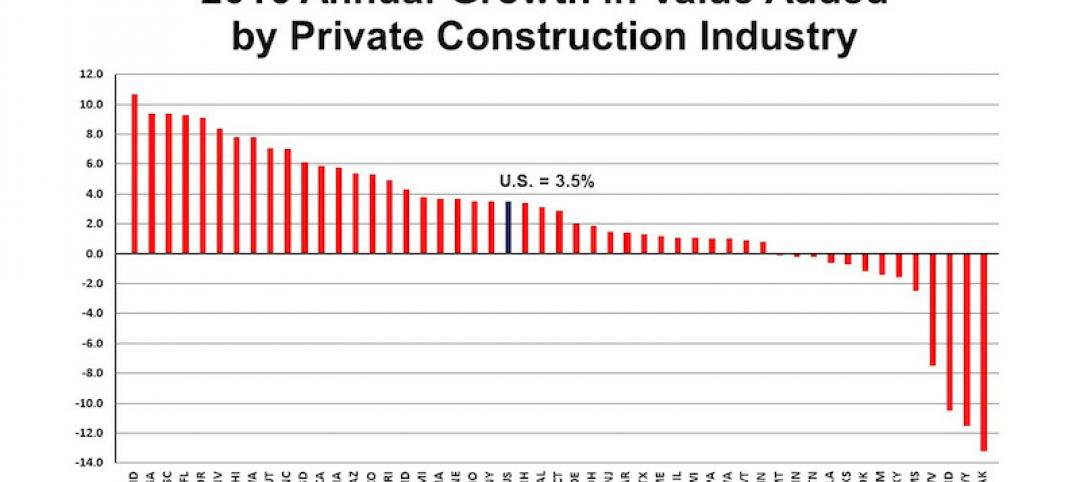
Construction's contribution to U.S. economy highest in seven years
Thirty-seven states benefited from the rise in construction activity in their state, while 13 states experienced a reduction in activity.
Market Data | Nov 15, 2017
Architecture Billings bounce back
Business conditions remain uneven across regions.
Market Data | Nov 14, 2017
U.S. construction starts had three consecutive quarters of positive growth in 2017
ConstructConnect’s quarterly report shows the most significant annual growth in the civil engineering and residential sectors.

Market Data | Nov 3, 2017
New construction starts in 2018 to increase 3% to $765 billion: Dodge report
Dodge Outlook Report predicts deceleration but still growth, reflecting a mixed pattern by project type.


