

The U.S. Green Building Council (USGBC) released its annual list of Top 10 States for LEED (Leadership in Energy and Environmental Design). Illinois topped the list, which ranks states based on the number of LEED certified square feet per person. The Top 10 states for LEED are home to 128 million Americans and together include more than 468 million gross square feet of LEED-certified space. Buildings that are LEED-certified create healthier spaces for people, as well as use less energy and water, reduce carbon emissions and save money for families, businesses and taxpayers.
“Over the past 25 years, the U.S. Green Building Council, its member companies and the green building community have come together to make our planet stronger, greener and more sustainable through LEED,” said Mahesh Ramanujam, president and CEO, USGBC. “These Top 10 states are examples of how we can create lasting, measurable change and improve the quality of life for everyone in our communities. A better future requires a universal living standard that leaves no one behind—and that future would simply not be possible without the extraordinary work being done in these states.”
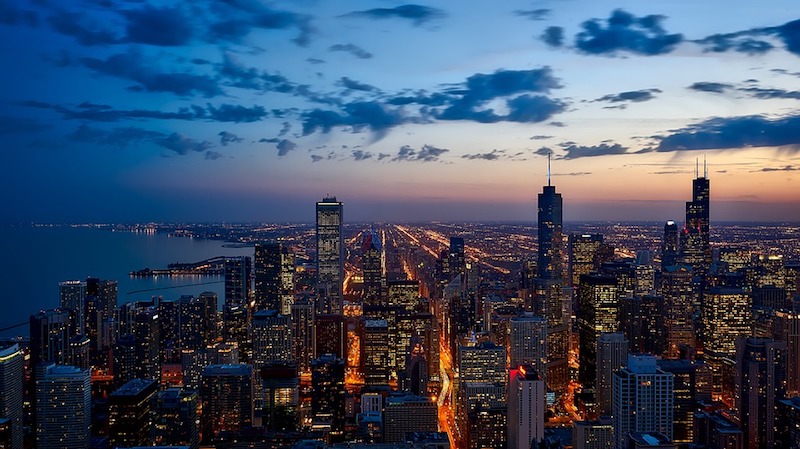
As the number one state for LEED certification in 2018, Illinois certified 172 green building projects representing 5.31 square feet of LEED-certified space per resident. This is the first time Illinois has taken the top spot since 2015. Washington and Texas also made triumphant returns to the Top 10 securing the highest rankings in each states’ history. In addition, Colorado made notable strides in its LEED activity moving from number 10 in 2017 to number six on this year’s list. The Top 10 list is based on 2010 U.S. Census data and includes commercial and institutional green building projects certified throughout 2018. The full rankings are as follows.
2018 Top 10 States for LEED
Rank State Certified Gross Square Footage (GSF) GSF Per Capita Number of Projects Certified
1 IL* 68,133,942 5.31 172
2 MA* 34,718,212 5.30 122
3 WA 28,555,753 4.25 137
4 NY* 72,881,287 3.76 214
5 TX 88,404,993 3.52 277
6 CO* 17,042,295 3.39 114
7 HI* 4,504,287 3.31 20
8 VA* 25,348,631 3.17 136
9 CA* 112,388,968 3.02 521
10 MD* 16,869,680 2.92 113
** DC 37,147,538 61.74 145
*Included in 2017 Top 10 States for LEED list
**Washington, D.C. is not ranked as it is a federal district, not a state
USGBC calculates the list using per capita figures to allow for a fair comparison of the level of green building taking place among states with significant differences in population and number of overall buildings. Notable projects that certified in each state in 2018 include:
• llinois: Northwestern Medicine Lake Forest Hospital is LEED Silver and part of a redeveloped campus that opened in March 2018 with over 700 physicians providing primary, specialty and emergency care;
• Massachusetts: Dr. Martin Luther King, Jr. School, LEED Platinum, served as a prototype for the Cambridge Green Schools Initiative and changed the way the District thinks about building energy while also using its design as a teaching tool for students;
• Washington: The LEED Platinum Seattle Fire Station 22 was designed to support the wellbeing of its firefighters while finding ways to reuse and conserve non-potable water to meet the station’s needs;
• New York: Albany Damien Center Residences is a LEED Gold housing project that has provided over 400 chronically homeless people living with HIV and AIDS with long-term housing stability;
• Texas: The LEED Silver Austin Animal Kennel expanded its facility to meet the city’s growing “No Kill” community and provides an additional 44 kennel spaces, as well as play yards and adoption rooms;
• Colorado: Jones Hall at the Colorado School for the Deaf and Blind is a historic building that achieved LEED Gold and provides a place for visiting families to stay as well as a repository of resources for students across the state;
• Hawaii: Hawaii Convention Center achieved LEED Gold and is focused on measuring environmental performance to improve visitor experience and uses Arc to track its sustainability efforts;
• Virginia: Operation Smile’s Global Headquarters used LEED to reflect its own commitment to make the world a better place during the construction of its new LEED Gold office in Virginia Beach;
• California: The Jet Propulsion Laboratory (JPL) achieved LEED Gold for Building 301 using LEED v4.1; LEED is used across JPL’s campus to compare progress and continuously improve building performance while also meeting federal guiding principles for sustainable buildings as a contractor to NASA; and
• Maryland: The Merriweather Post Pavilion Stagehouse is a LEED Silver home-away-from-home for touring artists playing at the iconic venue and reflects many of the artists environmental values.
While the Top 10 recognizes progress at the building level, LEED is also now used to measure sustainability performance at the city and community levels. This year, nine of the Top 10 states are also home to LEED-certified cities and communities, including Chicago, Seattle, Austin, San Diego County and more. There are currently more than 137 registered and certified LEED cities and communities around the world, representing more than 50 million people.
Despite Washington, D.C. not appearing in the official Top 10 list because of its status as a federal territory, it has consistently led the nation and in 2018 certified 61.74 square feet of space per resident across 145 green building projects. The nation’s capital has a strong legacy of sustainability leadership and in 2017 was the first city in the world to be LEED-certified.
Research shows green building will continue growing through 2021. Client demand remains the top reason to build green in the U.S. and occupant health and well-being emerged as the top social factor. Through LEED, USGBC pushes the market toward higher performing buildings that also improve quality of life. Recently, USGBC introduced LEED v4.1, the latest update to the rating system, and opened registration for existing buildings (LEED v4.1 O+M), new construction (LEED v4.1 BD+C) and interiors (LEED v4.1 ID+C). LEED v4.1 emphasizes human health and integrates performance metrics using Arc to encourage ongoing tracking. There are currently more than 96,275 registered and certified LEED projects in 167 countries and regions.
The impact of buildings, cities and communities on people continues to be a priority for USGBC and across industries. In an effort to expand USGBC’s global green building efforts and ensure that LEED is not only the de facto leadership standard, but also the pre-eminent living standard, USGBC launched the Living Standard campaign at 2018’s Greenbuild in Chicago. Focused on the belief that storytelling can lead to a more sustainable world, the campaign aims to highlight stories – big and small – that capture how USGBC, LEED and other sustainability programs are raising the quality of life for people around the world. By visiting livingstandard.org, individuals and companies can join the campaign and submit stories.
Related Stories

Hotel Facilities | Jul 28, 2022
As travel returns, U.S. hotel construction pipeline growth follows
According to the recently released United States Construction Pipeline Trend Report from Lodging Econometrics (LE), the total U.S. construction pipeline stands at 5,220 projects/621,268 rooms at the close of 2022’s second quarter, up 9% Year-Over-Year (YOY) by projects and 4% YOY by rooms.

Codes and Standards | Jul 22, 2022
Hurricane-resistant construction may be greatly undervalued
New research led by an MIT graduate student at the school’s Concrete Sustainability Hub suggests that the value of buildings constructed to resist wind damage in hurricanes may be significantly underestimated.

Market Data | Jul 21, 2022
Architecture Billings Index continues to stabilize but remains healthy
Architecture firms reported increasing demand for design services in June, according to a new report today from The American Institute of Architects (AIA).

Market Data | Jul 21, 2022
Despite deteriorating economic conditions, nonresidential construction spending projected to increase through 2023
Construction spending on buildings is projected to increase just over nine percent this year and another six percent in 2023, according to a new report from the American Institute of Architects (AIA).

Building Team | Jul 18, 2022
Understanding the growing design-build market
FMI’s new analysis of the design-build market forecast for the next fives years shows that this delivery method will continue to grow, despite challenges from the COVID-19 pandemic.

Market Data | Jul 1, 2022
Nonresidential construction spending slightly dips in May, says ABC
National nonresidential construction spending was down by 0.6% in May, according to an Associated Builders and Contractors analysis of data published today by the U.S. Census Bureau.

Market Data | Jun 30, 2022
Yardi Matrix releases new national rent growth forecast
Rents in most American cities continue to rise slightly each month, but are not duplicating the rapid escalation rates exhibited in 2021.

Market Data | Jun 22, 2022
Architecture Billings Index slows but remains strong
Architecture firms reported increasing demand for design services in May, according to a new report today from The American Institute of Architects (AIA).

Building Team | Jun 17, 2022
Data analytics in design and construction: from confusion to clarity and the data-driven future
Data helps virtual design and construction (VDC) teams predict project risks and navigate change, which is especially vital in today’s fluctuating construction environment.

Market Data | Jun 15, 2022
ABC’s construction backlog rises in May; contractor confidence falters
Associated Builders and Contractors reports today that its Construction Backlog Indicator increased to nine months in May from 8.8 months in April, according to an ABC member survey conducted May 17 to June 3. The reading is up one month from May 2021.


