


The Trump Administration’s plans for infrastructure investment, regulatory reform, and tax relief have ignited a burst of enthusiasm among U.S. engineering firm leaders, propelling the American Council of Engineering Companies’ Engineering Business Index (EBI) to its largest ever quarterly increase.
The 4th Quarter 2016 (Q4/2016) EBI surged 5.1 points to 66.5, up from the 61.4 score of Q3/2016. The previous largest increase was 1.5 points between the Q1/2014 and Q2/2014 surveys. Any score above 50 signifies that the market is growing The EBI is a leading indicator of America’s economic health based on the business performance and projections of engineering firms responsible for developing the nation’s transportation, water, energy, and industrial infrastructure. The Q4/2016 survey of 317 engineering firm leaders was conducted November 31 to December 20.
Survey results show firm leader market expectations for one year from today rose a hefty 8.8 points to 72.1, the largest quarter-over-quarter increase since the EBI’s inception in January 2014. Expectations for both short- and long-term profitability also climbed. Firm leader optimism for improved profitability over the next six months rose 3.6 points to 69.0; increased to 72.9 for one year from now; and climbed 2.9 points to 70.5 for three years from now.
“We finally have a president who understands business!” says one respondent. “We’re looking forward to some significant tax relief with the new Administration,” says another.
The boost in firm leader optimism extends across almost the entire engineering marketplace. In public markets, transportation showed the strongest increase, up an eye-catching 9.5 points to 73.7.
All other public market sectors rose: Water and Wastewater (up 7.5, to 70.5), Education (up 3.2 to 58.2) Health Care (up 0.3, to 56.1), and Environmental (up 1.1 to 55.4). A new public sector category, Buildings, debuted at 65.2. Among the private client markets, firm leaders were most bullish about the Industrial/Manufacturing sector, which leaped up 12.5 points to 70.7. Four key private sector markets also climbed: Energy and Power (up 8.8, to 69.2), Land Development (up 8.2, to 68.4.), Buildings (up 4.1 to 67.0), and Education (up 5.2, to 58.5).
For the complete Quarter 4, 2016 Engineering Business Index, go to www.acec.org.
Related Stories
Building Technology | Apr 11, 2016
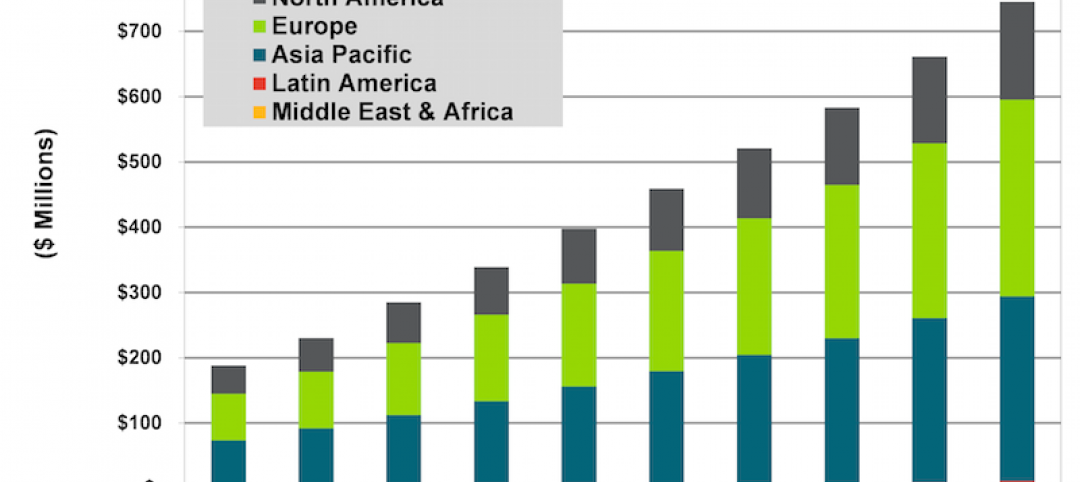
A nascent commercial wireless sensor market is poised to ascend in the next decade
Europe and Asia will propel that growth, according to a new report from Navigant.
Industry Research | Apr 7, 2016
CBRE provides latest insight into healthcare real estate investors’ strategies
Survey respondents are targeting smaller acquisitions, at a time when market cap rates are narrowing for different product types.

Market Data | Apr 4, 2016
ABC: Nonresidential spending slip in February no cause for alarm
Spending in the nonresidential sector totaled $690.3 billion on a seasonally adjusted, annualized basis in February. The figure is a step back but still significantly higher than one year ago.

Market Data | Mar 30, 2016
10 trends for commercial real estate: JLL report
The report looks at global threats and opportunities, and how CRE firms are managing their expectations for growth.

Market Data | Mar 23, 2016
AIA: Modest expansion for Architecture Billings Index
Business conditions softening most in Midwest in recent months.

Retail Centers | Mar 16, 2016
Food and technology will help tomorrow’s malls survive, says CallisonRTKL
CallisonRTKL foresees future retail centers as hubs with live/work/play components.

Market Data | Mar 6, 2016
Real estate execs measure success by how well they manage ‘talent,’ costs, and growth
A new CBRE survey finds more companies leaning toward “smarter” workspaces.

Market Data | Mar 1, 2016
ABC: Nonresidential spending regains momentum in January
Nonresidential construction spending expanded 2.5% on a monthly basis and 12.3% on a yearly basis, totaling $701.9 billion. Spending increased in January in 10 of 16 nonresidential construction sectors.

Market Data | Mar 1, 2016
Leopardo releases 2016 Construction Economics Report
This year’s report shows that spending in 2015 reached the highest level since the Great Recession. Total spending on U.S. construction grew 10.5% to $1.1 trillion, the largest year-over-year gain since 2007.

Market Data | Feb 26, 2016
JLL upbeat about construction through 2016
Its latest report cautions about ongoing cost increases related to finding skilled laborers.


