


Personal finance website WalletHub has recently determined which U.S. states have contributed most to America’s innovative success and which have been lacking.
The site analyzed the states (and the District of Columbia) across 18 key metrics such as share of STEM professionals, scientific knowledge output, eighth grade math and science performance, R&D spending per capita, tax friendliness, and average internet speed.
Below are some of the highlights from the analysis followed by the ten most and least innovative states:
- The District of Columbia has the highest share of STEM professionals, 9.4 percent, 2.8 times higher than in Mississippi and Nevada, which have the lowest at 3.3 percent each.
- Virginia has the highest share of technology companies, 7.52 percent, 3.9 times higher than in West Virginia, which has the lowest at 1.95 percent.
- New Mexico has the highest research and development (R&D) intensity, 6.31 percent, 19.7 times higher than in Wyoming, which has the lowest at 0.32 percent.
- The District of Columbia has the fastest average Internet speed, 22.47 Mbps, 2.1 times faster than in Idaho, which has the slowest at 10.65 Mbps.
- The District of Columbia has the highest share of public high-school students who completed advanced-placement (AP) exams, 60.2 percent, 4.4 times higher than in North Dakota, which has the lowest at 13.8 percent.
Most Innovative States
1. District of Columbia
2. Maryland
3. Massachusetts
4. California
5. Colorado
6. Washington
7. Virginia
8. Utah
9. Connecticut
10. New Hampshire
Least Innovative States
42. Maine
43. South Dakota
44. Iowa
45. Tennessee
46. North Dakota
47. Oklahoma
48. Kentucky
49. Louisiana
50. Mississippi
51. West Virginia
For the full list and an in-depth look at the methodology, click here.
Related Stories

Market Data | Jun 3, 2016
JLL report: Retail renovation drives construction growth in 2016
Retail construction projects were up nearly 25% year-over-year, and the industrial and office construction sectors fared well, too. Economic uncertainty looms over everything, however.

Market Data | Jun 2, 2016
ABC: Nonresidential construction spending down in April
Lower building material prices, a sluggish U.S. economy, and hesitation among private developers all factor into the 2.1% drop.

Market Data | May 20, 2016
Report: Urban area population growth slows
Older Millennials are looking to buy homes and move away to more affordable suburbs and exurbs.
Market Data | May 17, 2016
Modest growth for AIA’s Architecture Billings Index in April
The American Institute of Architects reported the April ABI score was 50.6, down from the mark of 51.9 in the previous month. This score still reflects an increase in design services.

Market Data | Apr 29, 2016
ABC: Quarterly GDP growth slowest in two years
Bureau of Economic Analysis data indicates that the U.S. output is barely growing and that nonresidential investment is down.

Market Data | Apr 20, 2016
AIA: Architecture Billings Index ends first quarter on upswing
The multi-family residential sector fared the best. The Midwest was the only U.S. region that didn't see an increase in billings.
Building Technology | Apr 11, 2016
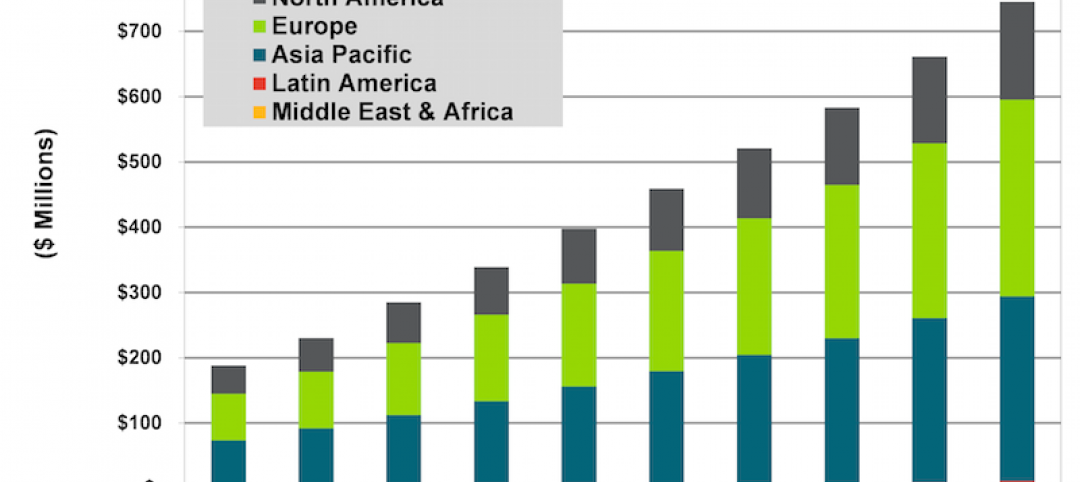
A nascent commercial wireless sensor market is poised to ascend in the next decade
Europe and Asia will propel that growth, according to a new report from Navigant.
Industry Research | Apr 7, 2016
CBRE provides latest insight into healthcare real estate investors’ strategies
Survey respondents are targeting smaller acquisitions, at a time when market cap rates are narrowing for different product types.

Market Data | Apr 4, 2016
ABC: Nonresidential spending slip in February no cause for alarm
Spending in the nonresidential sector totaled $690.3 billion on a seasonally adjusted, annualized basis in February. The figure is a step back but still significantly higher than one year ago.

Market Data | Mar 30, 2016
10 trends for commercial real estate: JLL report
The report looks at global threats and opportunities, and how CRE firms are managing their expectations for growth.


