

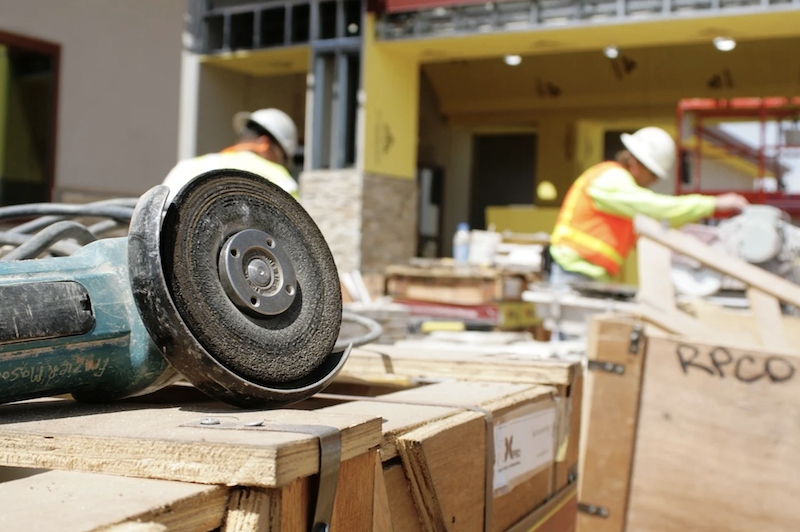
Extreme price increases continued in July for a wide range of goods and services used in construction, according to an analysis by the Associated General Contractors of America of government data released today. Association officials urged President Biden to immediately end tariffs and quotas on steel, aluminum, lumber and other essential construction items to help stave off inflationary pressure in the construction industry.
“July was the sixth-straight month of double-digit price increases for construction inputs,” said Ken Simonson, the association’s chief economist. “In addition, lead times to produce or deliver many items keep lengthening. Many reports since the government collected this price data in mid-July show the trend will continue, at a minimum into the autumn and likely beyond, unless tariffs and quotas are removed.”
The producer price index for new nonresidential construction—a measure of what contractors say they would charge to erect five types of nonresidential buildings—rose 4.4% over the past 12 months. That was a small fraction of the 25.6% increase in the prices that producers and service providers such as distributors and transportation firms charged for construction inputs, Simonson noted.
There were double-digit percentage increases in the selling prices of materials used in every type of construction. The producer price index for steel mill products more than doubled from July 2020 to last month, leaping 108.6%. The index for lumber and plywood jumped 56.8% despite a large drop in mill prices from May to July. The index for copper and brass mill shapes rose 49.0% and the index for aluminum mill shapes increased 33.2%. The index for plastic construction products rose 26.7%. The index for gypsum products such as wallboard climbed 21.6%. The index for insulation materials rose 11.8%, while the index for prepared asphalt and tar roofing and siding products rose 10.9%.
In addition to increases in materials costs, transportation and fuel costs also spiked. The index for truck transportation of freight jumped 13.8%. Fuel costs, which contractors pay directly to operate their own trucks and off-road equipment, as well as through surcharges on freight deliveries, have also jumped.
Association officials urged the president to remove tariffs on key construction materials, including steel and aluminum. They noted that some countries have opted for quotas on steel and aluminum in place of tariffs, making supplies even tighter. They said these government limitations on key materials, if left in place, would undermine some of the benefits of the new infrastructure measure that passed in the Senate
“These tariffs and quotas are artificially inflating the cost of many key materials and doing more damage to the economy than help,” said Stephen E. Sandherr, the association’s chief executive officer. “Leaving these measures in place will undermine the broader benefits of the bipartisan new infrastructure measure the House should be passing.”
View producer price index data. View chart of gap between input costs and bid prices. View the association’s Construction Inflation Alert.
Related Stories

Market Data | Feb 20, 2019
Strong start to 2019 for architecture billings
“The government shutdown affected architecture firms, but doesn’t appear to have created a slowdown in the profession,” said AIA Chief Economist Kermit Baker, Hon. AIA, PhD, in the latest ABI report.

Market Data | Feb 19, 2019
ABC Construction Backlog Indicator steady in Q4 2018
CBI reached a record high of 9.9 months in the second quarter of 2018 and averaged about 9.1 months throughout all four quarters of last year.

Market Data | Feb 14, 2019
U.S. Green Building Council announces top 10 countries and regions for LEED green building
The list ranks countries and regions in terms of cumulative LEED-certified gross square meters as of December 31, 2018.

Market Data | Feb 13, 2019
Increasingly tech-enabled construction industry powers forward despite volatility
Construction industry momentum to carry through first half of 2019.

Market Data | Feb 4, 2019
U.S. Green Building Council announces annual Top 10 States for LEED Green Building in 2018
Illinois takes the top spot as USGBC defines the next generation of green building with LEED v4.1.

Market Data | Feb 4, 2019
Nonresidential construction spending dips in November
Total nonresidential spending stood at $751.5 billion on a seasonally adjusted annualized rate.

Market Data | Feb 1, 2019
The year-end U.S. hotel construction pipeline continues steady growth trend
Project counts in the early planning stage continue to rise reaching an all-time high of 1,723 projects/199,326 rooms.

Market Data | Feb 1, 2019
Construction spending is projected to increase by more than 11% through 2022
FMI’s annual outlook also expects the industry’s frantic M&A activity to be leavened by caution going forward.

Market Data | Jan 23, 2019
Architecture billings slow, but close 2018 with growing demand
AIA’s Architecture Billings Index (ABI) score for December was 50.4 compared to 54.7 in November.

Market Data | Jan 16, 2019
AIA 2019 Consensus Forecast: Nonresidential construction spending to rise 4.4%
The education, public safety, and office sectors will lead the growth areas this year, but AIA's Kermit Baker offers a cautious outlook for 2020.


