

Nationally, the average cost to build out an office is $196.49/sf. But after taking into account the average landlord-provided tenant-improvement allowance of $43.61/sf, the out-of-pocket cost for tenants is $152.88/sf, according to JLL’s new U.S. Fit Out Guide.
The report combines fitout costs and tenant improvement allowances to paint a comprehensive picture of what companies can expect to pay out of pocket for an office buildout across the nation. It also details the most- and least-expensive markets for fitouts.
Coming out on top as the most expensive market to build out an office is Silicon Valley, Calif., with an out-of-pocket cost of $199.22. The most affordable market: Washington, D.C., at $103.88.
“It’s no surprise that the Northwest continues to be the most expensive region for office builds,” says Mason Mularoni, Senior Research Analyst, JLL Project and Development Services. Southern cities claimed six out of the 10 most affordable markets.
Due to the range of landlord-provided tenant improvement packages, some cities that made the top lists were pretty unexpected.
 Silicon Valley, Calif., is the most expensive market for office fitout projects, with an average out-of-pocket cost of $199.22/sf, according to JLL.
Washington, D.C.: most affordable. Often topping most-expensive lists, the District of Columbia is officially the most inexpensive market to build out an office space. As the federal government, contractors, and law firms continue to consolidate, slightly below-average buildout costs are offset by record-high concession packages from landlords who are desperate to get tenants into the exploding mass of available space.
Detroit: eighth most expensive. Once on the brink of financial collapse, the Motor City is being reinvigorated by an eager tech community. Startups, investors, and outside firms are attracted to the Motor City’s resolve to bounce back.
But Detroit isn’t in the clear just yet. Due to above-average buildout costs and minimal TI packages, the city swings in as one of the top out-of-pocket cost markets.
Los Angeles: sixth most affordable market to build out an office. New leasing activity has been nourished by the convergence of media, technology, and entertainment. The tech sector in particular has shown a preference for creative buildouts. LA’s enormous TI packages are tied with Washington, D.C., for largest in the nation, offering an affordable option in the notoriously expensive state.
Long Island, N.Y.: third most expensive, beating out traditional frontrunner New York City. When it comes to building costs alone, New York City tops the list. But substantial TI packages in the city allow Long Island to slide ahead in out-of-pocket costs, holding its own against the expensive Northern California cities.
Seattle: seventh most affordable. Although the Northwest region tops the most expensive list, Seattle is the exception to the rule. Technology continues to be the primary factor of the city, and significant growth is occurring from local companies as well as from tenants migrating from the Bay Area.
The second-largest TI package average across the nation enables Seattle to hold down seventh place in most-affordable-city honors.
Related Stories

Market Data | May 10, 2022
Hybrid work could result in 20% less demand for office space
Global office demand could drop by between 10% and 20% as companies continue to develop policies around hybrid work arrangements, a Barclays analyst recently stated on CNBC.

Market Data | May 6, 2022
Nonresidential construction spending down 1% in March
National nonresidential construction spending was down 0.8% in March, according to an Associated Builders and Contractors analysis of data published today by the U.S. Census Bureau.
Market Data | Apr 29, 2022
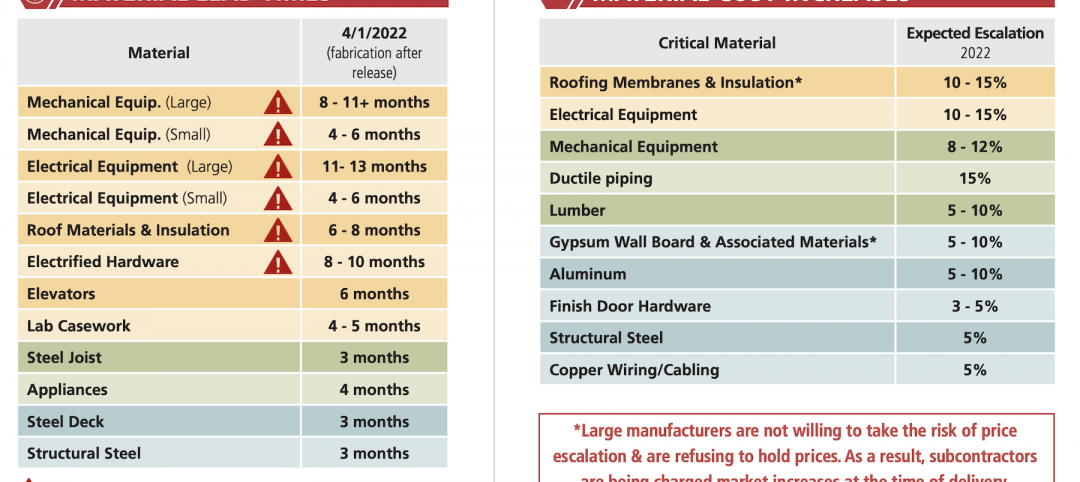
Global forces push construction prices higher
Consigli’s latest forecast predicts high single-digit increases for this year.

Market Data | Apr 29, 2022
U.S. economy contracts, investment in structures down, says ABC
The U.S. economy contracted at a 1.4% annualized rate during the first quarter of 2022.

Market Data | Apr 20, 2022
Pace of demand for design services rapidly accelerates
Demand for design services in March expanded sharply from February according to a new report today from The American Institute of Architects (AIA).

Market Data | Apr 14, 2022
FMI 2022 construction spending forecast: 7% growth despite economic turmoil
Growth will be offset by inflation, supply chain snarls, a shortage of workers, project delays, and economic turmoil caused by international events such as the Russia-Ukraine war.
Industrial Facilities | Apr 14, 2022
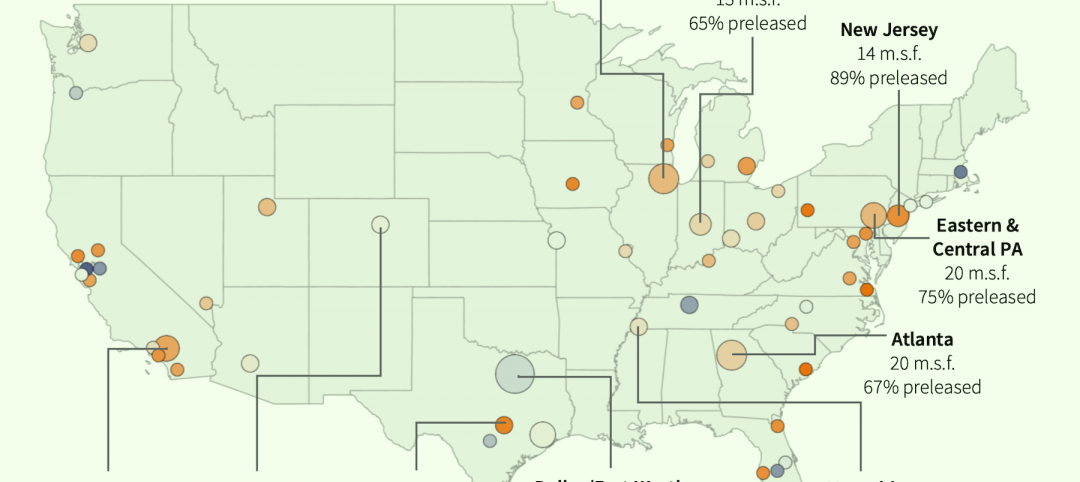
JLL's take on the race for industrial space
In the previous decade, the inventory of industrial space couldn’t keep up with demand that was driven by the dual surges of the coronavirus and online shopping. Vacancies declined and rents rose. JLL has just published a research report on this sector called “The Race for Industrial Space.” Mehtab Randhawa, JLL’s Americas Head of Industrial Research, shares the highlights of a new report on the industrial sector's growth.

Codes and Standards | Apr 4, 2022
Construction of industrial space continues robust growth
Construction and development of new industrial space in the U.S. remains robust, with all signs pointing to another big year in this market segment

Reconstruction & Renovation | Mar 28, 2022
Is your firm a reconstruction sector giant?
Is your firm active in the U.S. building reconstruction, renovation, historic preservation, and adaptive reuse markets? We invite you to participate in BD+C's inaugural Reconstruction Market Research Report.

Industry Research | Mar 28, 2022
ABC Construction Backlog Indicator unchanged in February
Associated Builders and Contractors reported today that its Construction Backlog Indicator remained unchanged at 8.0 months in February, according to an ABC member survey conducted Feb. 21 to March 8.


