


Analysts at Lodging Econometrics (LE) reported for the second quarter of 2019, the total U.S. construction pipeline climbed to 5,653 projects/693,207 rooms, up 6% by projects and 9% by rooms year-over-year (YOY). Pipeline totals are just 230 projects shy of the all-time high of 5,883 projects/785,547 rooms reached in the second quarter of 2008.
Projects currently under construction stand at 1,727 projects/233,600 rooms with projects scheduled to start construction in the next 12 months at 2,552 projects/295,989 rooms. Both are at the highest levels since early 2008. Projects in the early planning stage stand at 1,374 projects/163,618 rooms.
In the first half of 2019, the industry opened 456 new hotels with 53,427 rooms. An additional 599 projects/66,300 rooms are expected to open by year-end. In 2020, the LE forecasts for new hotel openings continues to rise with 1,161 new hotels/129,531 rooms scheduled to open. In 2021, with a growth rate of 2.5%, 1,206 new hotels with 139,793 rooms are likely to open as a result of the current robust pipeline. Should all these hotels come to fruition, 2021 will register the highest count for new hotel openings since 2009.
Trendline analysis suggests that the pipeline is in a topping out formation as new project announcements into the pipeline in the second quarter are at 359 projects/ 44,895 rooms, their lowest count since the fourth quarter of 2014. Brand to brand conversions have also declined over the last year and are at the lowest level since the end of 2016.
Although government spending and consumer sentiment and spending remain strong, these declines can be attributed to business spending declines which have turned negative for the first time since early 2016. Declines are due primarily to the uncertainty caused by trade and tariff problems and the slowing global economy.
Leading Markets in The U.S. Hotel Construction Pipeline
At the end of the first half of 2019, analysts at Lodging Econometrics (L.E.) report that the top five markets with the largest hotel construction pipelines are New York City with 166 projects/28,231 rooms. Next are Dallas and Los Angeles with 162 projects/19,972 rooms and 158 projects/25,428 rooms, respectively. Houston follows with 146 projects/14,998 rooms, and Atlanta with 130 projects/17,280 rooms. With the exception of NYC and Houston, these top markets are at record high counts.
The top ten markets in the pipeline including the five markets mentioned above plus Nashville, Austin, Orlando, Detroit, and Charlotte account for 25% of the rooms in the total pipeline. Ten states claim a whopping 61% of the rooms in the pipeline: Texas, California, Florida, New York, Georgia, Tennessee, North Carolina, Michigan, Colorado, and Ohio.
For the first half of 2019, the U.S. has opened 456 new hotels/53,527 rooms with another 599 new hotels/66,300 rooms expected to open by year-end. Reflective of the robust pipeline, L.E.’s forecast for new hotel openings will continue to rise through 2021.
Twenty-five percent of the new hotels forecast to open between now and the 2021 year-end are concentrated in ten markets. These markets are New York City, Los Angeles, Orlando, Dallas, Atlanta, Nashville, Houston, Washington DC, Miami, and Phoenix. The top 25 markets are forecast to open 40% of the rooms expected to open.
Related Stories

Market Data | Sep 11, 2019
New 2030 Commitment report findings emphasize need for climate action
Profession must double down on efforts to meet 2030 targets.

Market Data | Sep 10, 2019
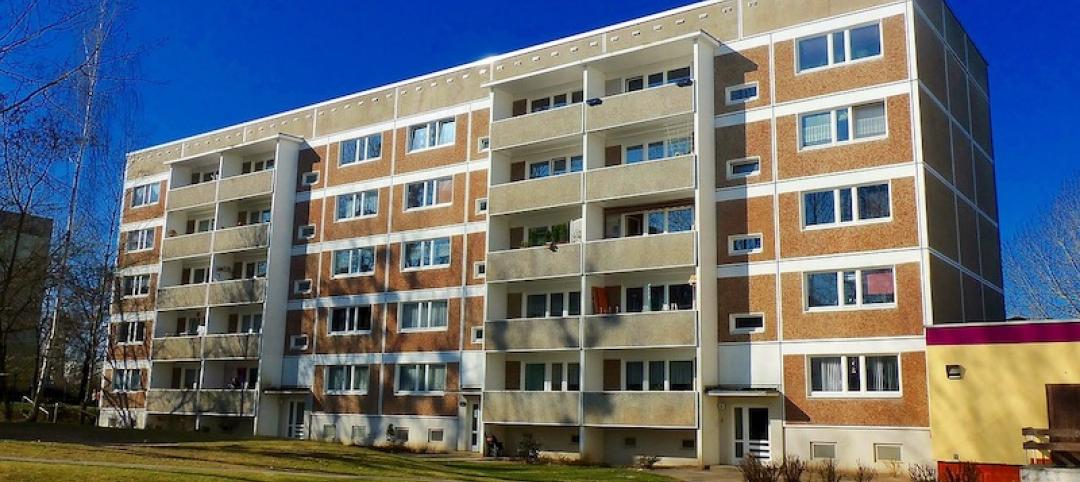
Apartment buildings and their residents contribute $3.4 trillion to the national economy
New data show how different aspects of the apartment industry positively impact national, state and local economies.

Market Data | Sep 3, 2019
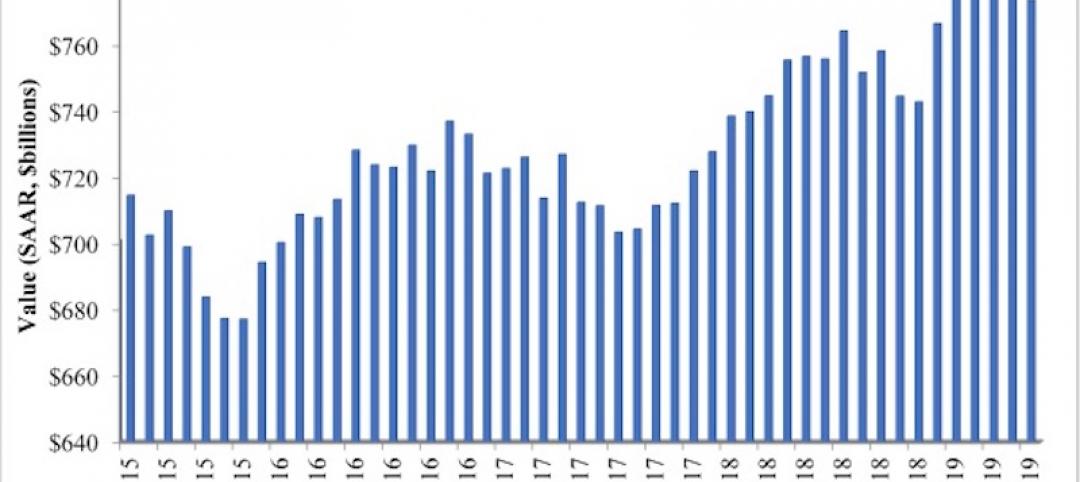
Nonresidential construction spending slips in July 2019, but still surpasses $776 billion
Construction spending declined 0.3% in July, totaling $776 billion on a seasonally adjusted annualized basis.
Industry Research | Aug 29, 2019
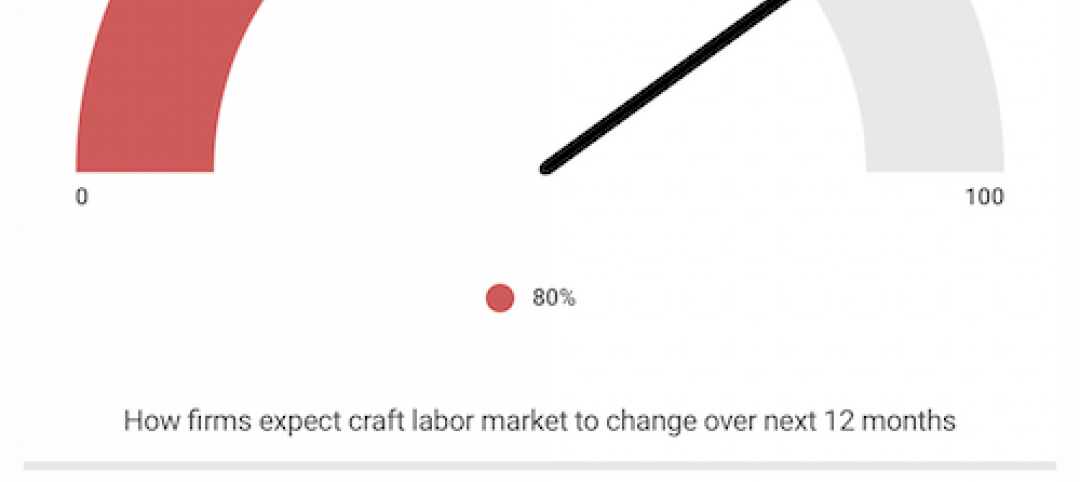
Construction firms expect labor shortages to worsen over the next year
A new AGC-Autodesk survey finds more companies turning to technology to support their jobsites.
Market Data | Aug 21, 2019
Architecture Billings Index continues its streak of soft readings
Decline in new design contracts suggests volatility in design activity to persist.
Market Data | Aug 19, 2019
Multifamily market sustains positive cycle
Year-over-year growth tops 3% for 13th month. Will the economy stifle momentum?

Market Data | Aug 16, 2019
Students say unclean restrooms impact their perception of the school
The findings are part of Bradley Corporation’s Healthy Hand Washing Survey.

Market Data | Aug 12, 2019
Mid-year economic outlook for nonresidential construction: Expansion continues, but vulnerabilities pile up
Emerging weakness in business investment has been hinting at softening outlays.

Market Data | Aug 7, 2019
National office vacancy holds steady at 9.7% in slowing but disciplined market
Average asking rental rate posts 4.2% annual growth.
Market Data | Aug 1, 2019
Nonresidential construction spending slows in June, remains elevated
Among the 16 nonresidential construction spending categories tracked by the Census Bureau, seven experienced increases in monthly spending.


