


Analysts at Lodging Econometrics (LE) reported for the second quarter of 2019, the total U.S. construction pipeline climbed to 5,653 projects/693,207 rooms, up 6% by projects and 9% by rooms year-over-year (YOY). Pipeline totals are just 230 projects shy of the all-time high of 5,883 projects/785,547 rooms reached in the second quarter of 2008.
Projects currently under construction stand at 1,727 projects/233,600 rooms with projects scheduled to start construction in the next 12 months at 2,552 projects/295,989 rooms. Both are at the highest levels since early 2008. Projects in the early planning stage stand at 1,374 projects/163,618 rooms.
In the first half of 2019, the industry opened 456 new hotels with 53,427 rooms. An additional 599 projects/66,300 rooms are expected to open by year-end. In 2020, the LE forecasts for new hotel openings continues to rise with 1,161 new hotels/129,531 rooms scheduled to open. In 2021, with a growth rate of 2.5%, 1,206 new hotels with 139,793 rooms are likely to open as a result of the current robust pipeline. Should all these hotels come to fruition, 2021 will register the highest count for new hotel openings since 2009.
Trendline analysis suggests that the pipeline is in a topping out formation as new project announcements into the pipeline in the second quarter are at 359 projects/ 44,895 rooms, their lowest count since the fourth quarter of 2014. Brand to brand conversions have also declined over the last year and are at the lowest level since the end of 2016.
Although government spending and consumer sentiment and spending remain strong, these declines can be attributed to business spending declines which have turned negative for the first time since early 2016. Declines are due primarily to the uncertainty caused by trade and tariff problems and the slowing global economy.
Leading Markets in The U.S. Hotel Construction Pipeline
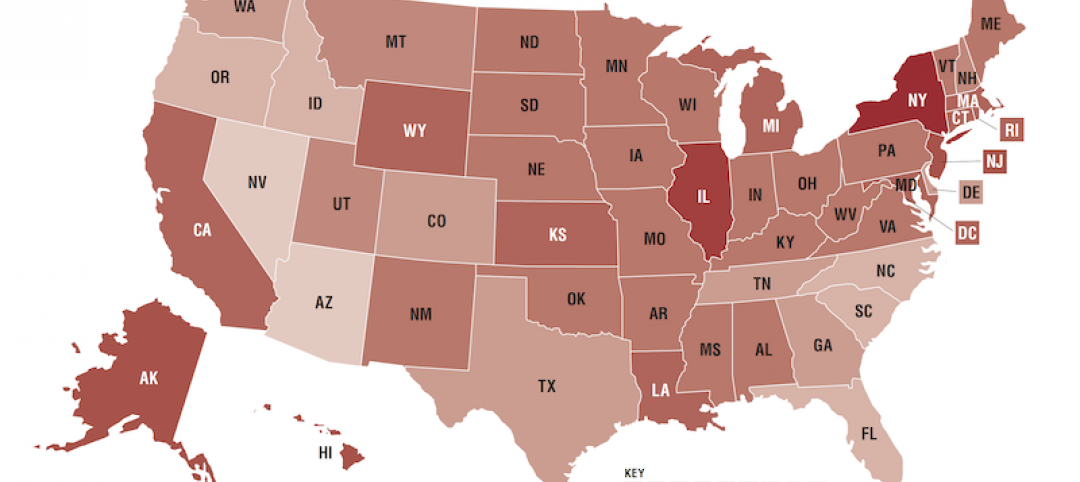
At the end of the first half of 2019, analysts at Lodging Econometrics (L.E.) report that the top five markets with the largest hotel construction pipelines are New York City with 166 projects/28,231 rooms. Next are Dallas and Los Angeles with 162 projects/19,972 rooms and 158 projects/25,428 rooms, respectively. Houston follows with 146 projects/14,998 rooms, and Atlanta with 130 projects/17,280 rooms. With the exception of NYC and Houston, these top markets are at record high counts.
The top ten markets in the pipeline including the five markets mentioned above plus Nashville, Austin, Orlando, Detroit, and Charlotte account for 25% of the rooms in the total pipeline. Ten states claim a whopping 61% of the rooms in the pipeline: Texas, California, Florida, New York, Georgia, Tennessee, North Carolina, Michigan, Colorado, and Ohio.
For the first half of 2019, the U.S. has opened 456 new hotels/53,527 rooms with another 599 new hotels/66,300 rooms expected to open by year-end. Reflective of the robust pipeline, L.E.’s forecast for new hotel openings will continue to rise through 2021.
Twenty-five percent of the new hotels forecast to open between now and the 2021 year-end are concentrated in ten markets. These markets are New York City, Los Angeles, Orlando, Dallas, Atlanta, Nashville, Houston, Washington DC, Miami, and Phoenix. The top 25 markets are forecast to open 40% of the rooms expected to open.
Related Stories

Multifamily Housing | Oct 16, 2019
A new study wonders how many retiring adults will be able to afford housing
Harvard’s Joint Center for Housing Studies focuses on growing income disparities among people 50 or older.
Market Data | Oct 9, 2019
Two ULI reports foresee a solid real estate market through 2021
Market watchers, though, caution about a “surfeit” of investment creating a bubble.
Market Data | Oct 4, 2019
Global construction output growth will decline to 2.7% in 2019
It will be the slowest pace of growth in a decade, according to GlobalData.

Market Data | Oct 2, 2019
Spending on nonresidential construction takes a step back in August
Office, healthcare, and public safety are among the fastest-growing sectors, according to the U.S. Census Bureau's latest report.

Market Data | Sep 27, 2019
The global hotel construction pipeline ascends to new record highs
With the exception of Latin America, all regions of the globe either continued to set record high pipeline counts or have already settled into topping-out formations amidst concerns of a worldwide economic slowdown.
Market Data | Sep 25, 2019
Senate introduces The School Safety Clearinghouse Act
Legislation would create a federally funded and housed informational resource on safer school designs.
Market Data | Sep 18, 2019
Substantial decline in Architecture Billings
August report suggests greatest weakness in design activity in several years.
Market Data | Sep 17, 2019
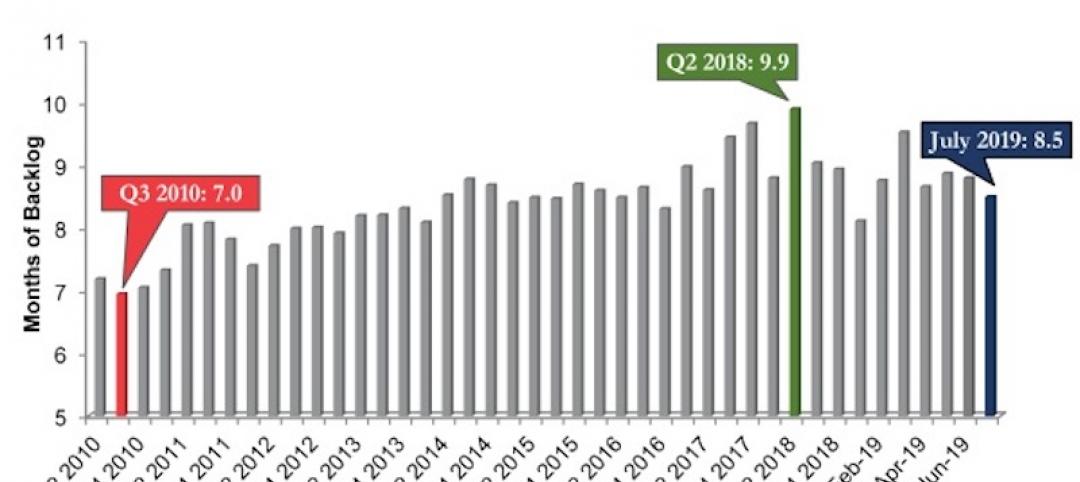
ABC’s Construction Backlog Indicator inches lower in July
Backlog in the heavy industrial category increased by 2.3 months and now stands at its highest level in the history of the CBI series.

Market Data | Sep 13, 2019
Spending on megaprojects, already on the rise, could spike hard in the coming years
A new FMI report anticipates that megaprojects will account for one-fifth of annual construction spending within the next decade.

Architects | Sep 11, 2019
Buoyed by construction activity, architect compensation continues to see healthy gains
The latest AIA report breaks down its survey data by 44 positions and 28 metros.


