


There are many new and exciting applications for data analysis in the construction industry, the vast majority of which employ new data aggregation tools to quantify and analyze specific aspects of the built environment, often numerical aspects like square foot totals, or asset management counts. But there are other important uses for data tools for more abstract attributes of the built environment, such as tracking, analyzing and evaluating risk.
This case-study details a facilities assessment for a government client who needed to understand the range of risk types and impacts that could potentially occur in their buildings. The analysis was triggered when a single pipe failure on the 11th floor of one facility unleashed a cascade of unforeseen consequences as it made its way to ground, almost paralyzing the facility for several days. The consequences rippled through the facility long after the event.
As a result, the client, a proactive owner-occupier, commissioned a comprehensive assessment of their three largest facilities to help enumerate and understand other similar vulnerabilities in each facility, so as to avoid future similar exposures.
Evaluating the Facilities
As a first step, the team visited the three facilities, totaling over two million SF, and surveyed each system’s equipment and arrangement. Because each of the facilities was large, and built over several decades, the range of equipment and systems encountered varied from new to those which were teetering on the end of their useful life. All of this data was captured with a brief narrative for each item, as well as a mitigation strategy.
Once the list of infrastructure, equipment, layout and configurations of each facility was completed, the team assigned each of the identified issues a category, such as site work, building envelope, electrical equipment, mechanical systems and even security protocols. In addition, they further classified each item according to two important decision-oriented factors: 1) its likelihood to occur, and 2) the impact of a failure were it to occur. They then took the categorized items and assigned a rough dollar amount to address and fix each work item.
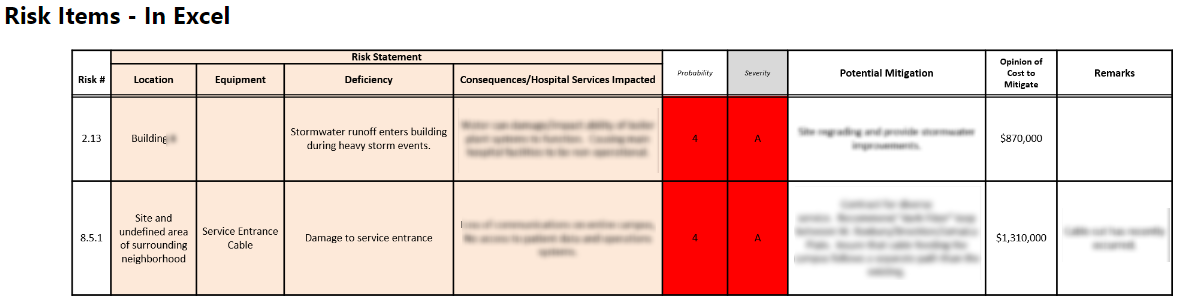
The data had several data categories, or “dimensions.”
When completed, the final spreadsheet was a lengthy inventory of future work-items arranged by category, cost, likelihood and severity. In data jargon, each of these traits – category, cost severity, likelihood, etc. - would be called ‘dimensions’, that is aspects of the item that help to understand the problem. Each dimension represents a way to slice the data. Thus, with the right tool an owner could start to drill into the hundreds of items, even with combinations of dimensions.
Leveraging Data Tools
With over 1,000 items cataloged and several dimensions to simultaneously evaluate, the next task was to address was how best to turn the data into information – that is actionable decisions to help address the facility needs. In its raw form, the initial spreadsheet report was rich with information but was somewhat cumbersome to navigate for everyday use by the facility manager.
ALSO SEE: BI(m): BIM data without models
In addition, with so many measures, the team needed the capability to drill down into the findings to be able to pose various questions:
• Which items were the most critical points of failure for service continuity?
• Were there certain categories of vulnerabilities that occurred frequently in each facility?
• What was the total capital cost by category, such as critical items and less critical items?
These were all valid questions that would take quite a while to deduce from a straight spreadsheet format. For the next step, the team imported the raw data into a data analysis application.
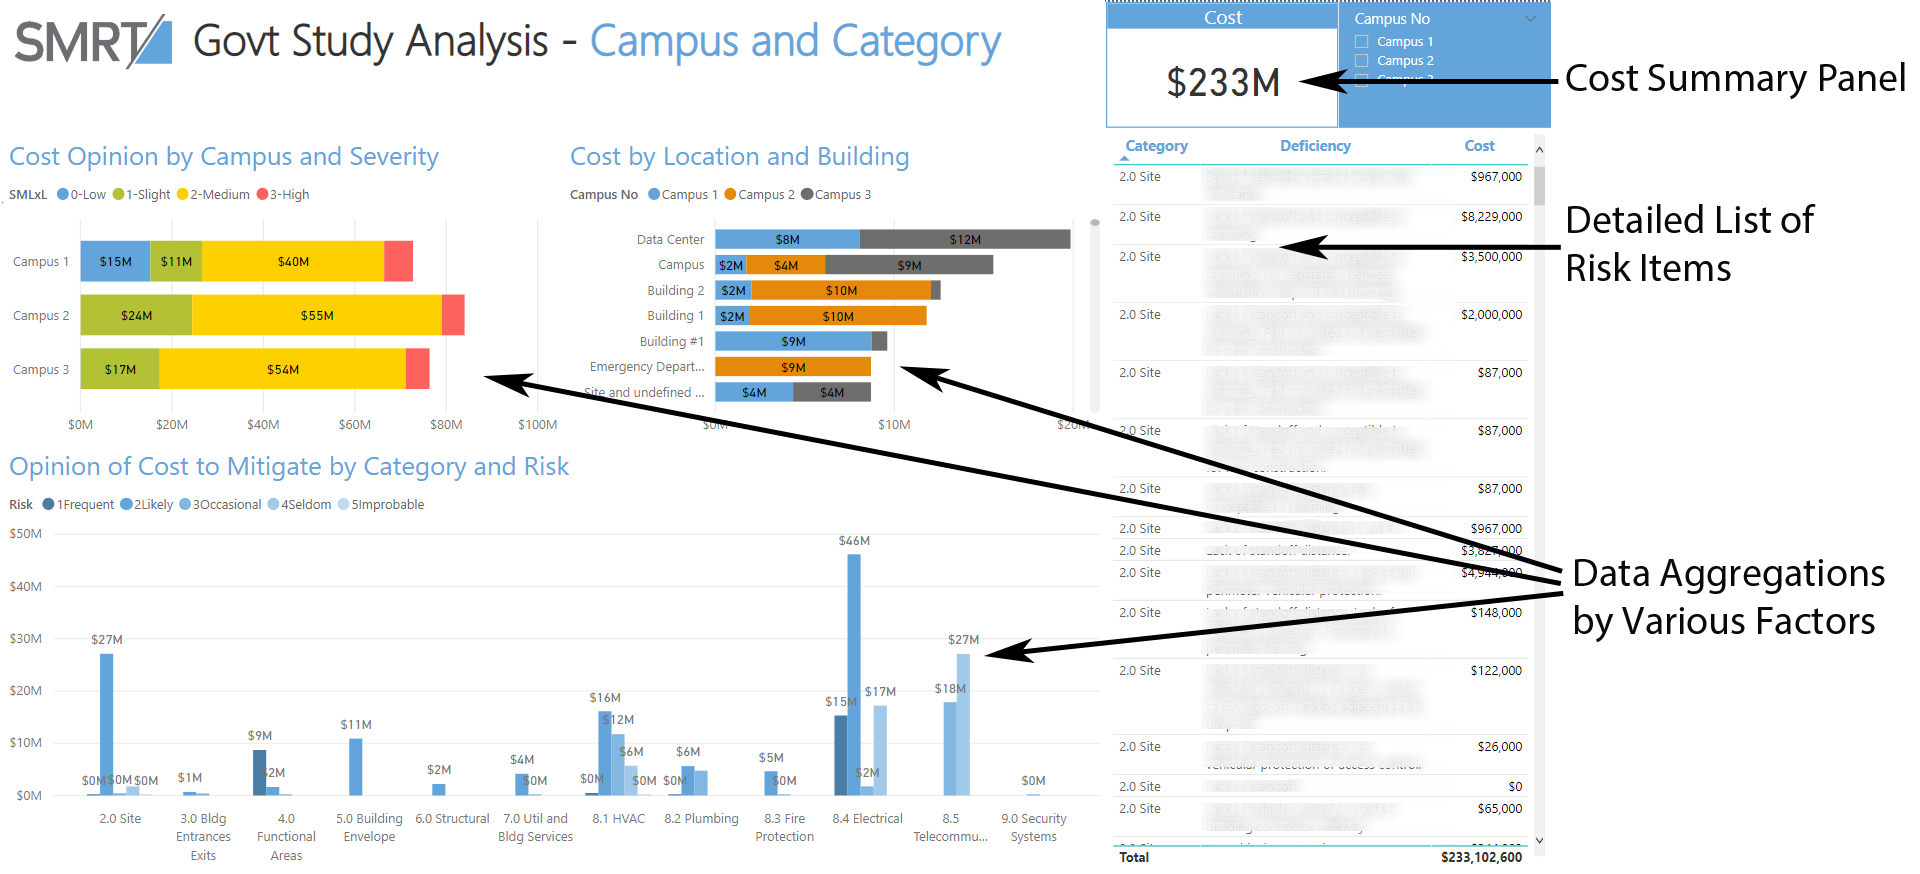
A collection of charts on a single page; each chart is interactive, so that clicking on it filters the surrounding charts.
By using the advanced pivoting and aggregation of data analytical tools, the engineering team was able to scrutinize the data and display it graphically in a way the facility manager could more readily comprehend. A diverse collection of tables and column charts, organized and colored by severity or category, told a far more vivid story of the work items for each facility. For example, it was easier to see which items needed to be addressed immediately and which were those that could happen sometime over a longer timeframe.
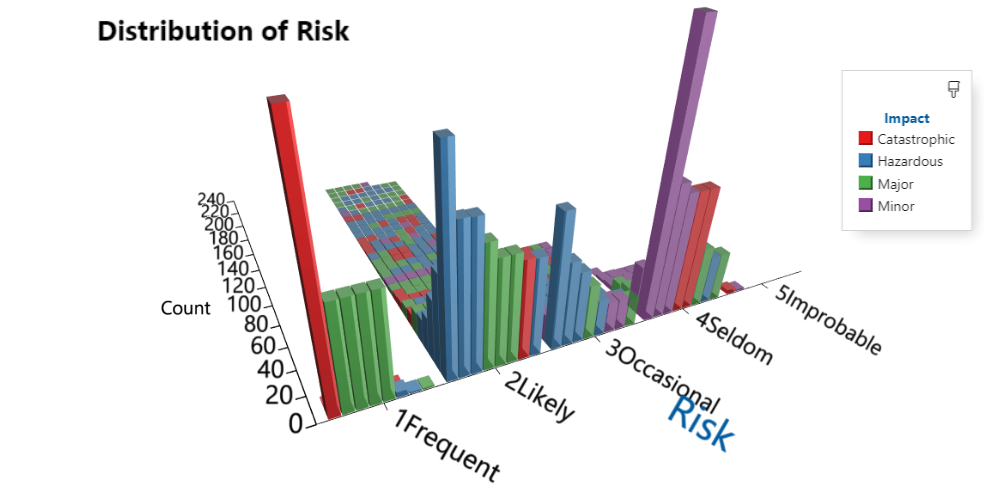
3D charts with a color legend can display four dimensions at once.
Using the data tools, the team was even able to create three-dimensional chart formats that provided a very rich assessment of each item by campus, capital cost, severity and likelihood of occurrence all in a single comprehensive view. Each item could also display additional information about the line item when the user hovered over it. Thus, the new data tools allowed the reader to comprehend major trends and highpoints in a highly integrated way.
Even after the site survey activity was complete, there were further opportunities to ‘extend’ - or enhance - the original raw survey data spreadsheet with other data points subsequent to the survey, such as an anticipated contract date for when each item might need to be performed. As a result, extending the data resulted in a date chart to gauge future expenditures for each year, and also an average yearly spend rate for the facilities. The team could see that in 15 years for example, a large sum of funds would be needed to avoid disruptions to services. This chart could be further analyzed by severity or impact.
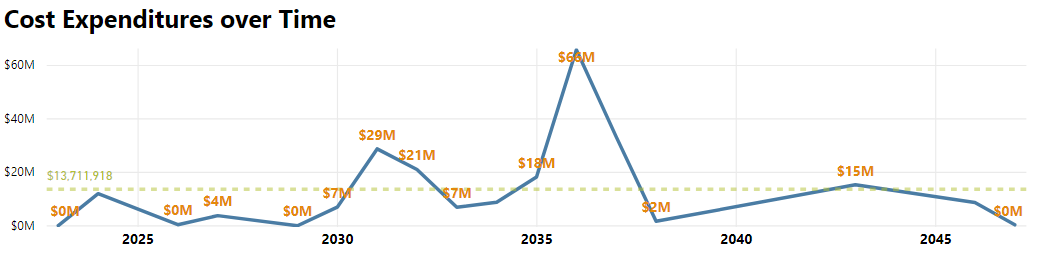
An anticipated contract date was added to each work item to forecast capital expenditures over the next 25 years.
Seeing the Forest AND the Tree
The risk analysis study illustrated how risk mitigation studies can be greatly enhanced with new data tools. We like to say that the team sees the power of data analytics to be that the owner “can see the forest AND the tree” – meaning, - where previous typical reports either summarized the findings, (the Forest), or itemized them in individual detail, (the Trees), - these new tools allowed the forest of measures to be displayed at once, and then through drilldown and interactive graphics, enabled custom aggregations as well as isolation of individual trees. As such, data analysis tools constitute a significant leap for facility managers and building professionals to help catalog, understand and strategize around facility conditions and plan future capital expenditures to address risks and vulnerabilities.
The uses of data in construction go far beyond mere floor areas and quantities, - in this case evaluating the risk posed to critical facilities. What is most valuable about these tools is how they helped to make complex and abstract aspects of buildings more visible.
About the Author
John Tobin is the Albany, N.Y., Office Director for SMRT Architects and Engineers, headquartered in Portland, Maine. He has spent three decades spearheading new practice technologies, especially BIM and advanced delivery, and then as an AE technology and operations leader. Most recently, Tobin has begun integrating new data analysis techniques with BIM processes.
Related Stories
 integration is one of the most adopted technologies by building product manufacturers, according to the survey")
AEC Tech | May 9, 2023
4 insights on building product manufacturers getting ‘smart’
Overall, half of building product manufacturers plan to invest in one or more areas of technology in the next three years.

Sustainability | May 1, 2023
Increased focus on sustainability is good for business and attracting employees
A recent study, 2023 State of Design & Make by software developer Autodesk, contains some interesting takeaways for the design and construction industry. Respondents to a survey of industry leaders from the architecture, engineering, construction, product design, manufacturing, and entertainment spheres strongly support the idea that improving their organization’s sustainability practices is good for business.

AEC Tech | May 1, 2023
Utilizing computer vision, AI technology for visual jobsite tasks
Burns & McDonnell breaks down three ways computer vision can effectively assist workers on the job site, from project progress to safety measures.

AEC Tech Innovation | Apr 27, 2023
Does your firm use ChatGPT?
Is your firm having success utilizing ChatGPT (or other AI chat tools) on your building projects or as part of your business operations? If so, we want to hear from you.

Design Innovation Report | Apr 19, 2023
HDR uses artificial intelligence tools to help design a vital health clinic in India
Architects from HDR worked pro bono with iKure, a technology-centric healthcare provider, to build a healthcare clinic in rural India.

Resiliency | Apr 18, 2023
AI-simulated hurricanes could aid in designing more resilient buildings
Researchers at the National Institute of Standards and Technology (NIST) have devised a new method of digitally simulating hurricanes in an effort to create more resilient buildings. A recent study asserts that the simulations can accurately represent the trajectory and wind speeds of a collection of actual storms.

3D Printing | Apr 11, 2023
University of Michigan’s DART Laboratory unveils Shell Wall—a concrete wall that’s lightweight and freeform 3D printed
The University of Michigan’s DART Laboratory has unveiled a new product called Shell Wall—which the organization describes as the first lightweight, freeform 3D printed and structurally reinforced concrete wall. The innovative product leverages DART Laboratory’s research and development on the use of 3D-printing technology to build structures that require less concrete.

Smart Buildings | Apr 7, 2023
Carnegie Mellon University's research on advanced building sensors provokes heated controversy
A research project to test next-generation building sensors at Carnegie Mellon University provoked intense debate over the privacy implications of widespread deployment of the devices in a new 90,000-sf building. The light-switch-size devices, capable of measuring 12 types of data including motion and sound, were mounted in more than 300 locations throughout the building.

Architects | Apr 6, 2023
New tool from Perkins&Will will make public health data more accessible to designers and architects
Called PRECEDE, the dashboard is an open-source tool developed by Perkins&Will that draws on federal data to identify and assess community health priorities within the U.S. by location. The firm was recently awarded a $30,000 ASID Foundation Grant to enhance the tool.

AEC Tech | Mar 14, 2023
Skanska tests robots to keep construction sites clean
What if we could increase consistency and efficiency with housekeeping by automating this process with a robot? Introducing: Spot.


