

The cost of goods and services used in construction accelerated further in April as more items logged double-digit increases over the past year, according to an analysis by the Associated General Contractors of America of government data released today. Meanwhile, nonresidential contractors struggled with delays in receiving materials and intensifying competition that limited their ability to pass on higher costs. Association officials urged the Biden administration to quickly roll back tariffs and quotas on imported construction materials that are adding to costs and availability problems.
“Today’s producer price index report—bad though it is—actually understates the severity of the problems contractors are experiencing,” said Ken Simonson, the association’s chief economist. “Many items have posted even steeper price increases since the data for this report were collected in mid-April, while lead times for producing goods and delivery times to distributors and worksites have grown ever longer and less certain.”
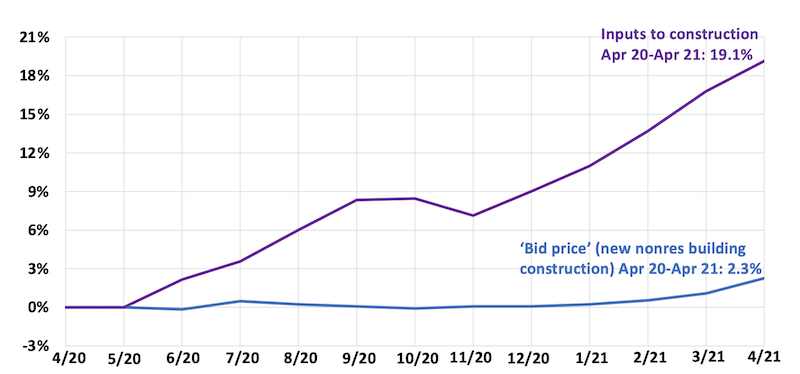
Prices for materials used in construction jumped 19.7% from April 2020 to last month. That was by far the largest increase in the 35-year history of the series, Simonson said. A series that includes services as well as goods purchased by contractors increased nearly as much, 19.1%. Meanwhile, the producer price index for new nonresidential construction—a measure of what contractors say they would charge to erect five types of nonresidential buildings—rose only 2.3% over the past 12 months, as competition for a shrinking pool of new projects forced contractors to absorb most of the increases.
Items with especially steep price increases over the past year ranged from lumber to metals to plastics. The producer price index for lumber and plywood soared 85.7% from April 2020 to last month. The index for steel mill products climbed 67%, while the index for copper and brass mill shapes rose 49% and the index for aluminum mill shapes increased 20.5%. The index for plastic construction products rose 14.2% amid growing scarcity of items such as PVC pipe, vinyl siding and moisture barriers, and resins used in paints and adhesives. The index for gypsum products such as wallboard climbed 12.1%.
Association officials said some of the supply chain problems have resulted from the pandemic or one-time events like the freeze in Texas last February that damaged plants producing inputs for construction plastics. But they added that federal policies, particularly tariffs and quotas on key building materials like lumber, steel, and aluminum have exacerbated the price spikes, supply shortages, and delivery delays. They urged the administration to end those import obstacles and explore ways to help uncork supply-chain bottlenecks.
“The Biden administration must address these unprecedented lumber and steel costs and broader supply-chain woes or risk undermining the economic recovery,” said Stephen E. Sandherr, the association’s chief executive officer. “Without tariff relief and other measures, vital construction projects will fall behind schedule or be canceled.”
View producer price index data. View chart of gap between input costs and bid prices. View AGC’s Construction Inflation Alert.
Related Stories

Market Data | Feb 20, 2019
Strong start to 2019 for architecture billings
“The government shutdown affected architecture firms, but doesn’t appear to have created a slowdown in the profession,” said AIA Chief Economist Kermit Baker, Hon. AIA, PhD, in the latest ABI report.

Market Data | Feb 19, 2019
ABC Construction Backlog Indicator steady in Q4 2018
CBI reached a record high of 9.9 months in the second quarter of 2018 and averaged about 9.1 months throughout all four quarters of last year.

Market Data | Feb 14, 2019
U.S. Green Building Council announces top 10 countries and regions for LEED green building
The list ranks countries and regions in terms of cumulative LEED-certified gross square meters as of December 31, 2018.

Market Data | Feb 13, 2019
Increasingly tech-enabled construction industry powers forward despite volatility
Construction industry momentum to carry through first half of 2019.

Market Data | Feb 4, 2019
U.S. Green Building Council announces annual Top 10 States for LEED Green Building in 2018
Illinois takes the top spot as USGBC defines the next generation of green building with LEED v4.1.

Market Data | Feb 4, 2019
Nonresidential construction spending dips in November
Total nonresidential spending stood at $751.5 billion on a seasonally adjusted annualized rate.

Market Data | Feb 1, 2019
The year-end U.S. hotel construction pipeline continues steady growth trend
Project counts in the early planning stage continue to rise reaching an all-time high of 1,723 projects/199,326 rooms.

Market Data | Feb 1, 2019
Construction spending is projected to increase by more than 11% through 2022
FMI’s annual outlook also expects the industry’s frantic M&A activity to be leavened by caution going forward.

Market Data | Jan 23, 2019
Architecture billings slow, but close 2018 with growing demand
AIA’s Architecture Billings Index (ABI) score for December was 50.4 compared to 54.7 in November.

Market Data | Jan 16, 2019
AIA 2019 Consensus Forecast: Nonresidential construction spending to rise 4.4%
The education, public safety, and office sectors will lead the growth areas this year, but AIA's Kermit Baker offers a cautious outlook for 2020.


