


Only 16 states and the District of Columbia have added construction jobs since just before the start of the pandemic in February 2020, according to a new analysis of federal employment data released today by the Associated General Contractors of America. Association officials noted that prospects for the sector’s recovery will be diminished should the House-passed Build Back Better bill become law.
“Although activity picked up in most states in October, construction employment remains below pre-pandemic levels in two out of three states,” said Ken Simonson, the association’s chief economist. “The record number of job openings shows contractors are eager to hire more workers but can’t find enough qualified applicants.”
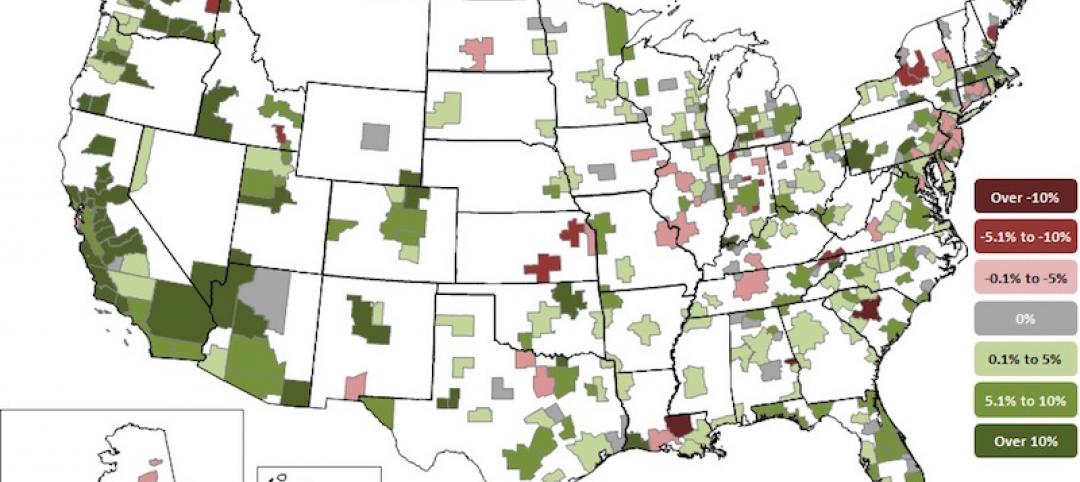
From February 2020—the month before the pandemic caused projects to be halted or canceled—to last month, construction employment decreased in 33 states, stalled in Hawaii, and increased in only 16 states and D.C. Texas shed the most construction jobs over the period (-46,400 jobs or -5.9%), followed by New York (-42,800 jobs, -10.5%) and California (-21,300 jobs, -2.3%). The largest percentage losses were in Wyoming (-14.0%, -3,200 jobs), New York, and Vermont (-9.8%, -1,500 jobs),
Utah added the most construction jobs since February 2020 (8,200 jobs, 7.2%), followed by North Carolina (7,700 jobs, 3.3%), Washington (4,900 jobs, 2.2%), and Idaho (4,900 jobs, 8.9%). The largest percentage gains were in South Dakota (10.5%, 2,500 jobs), Idaho, and Utah.
From September to October construction employment decreased in 14 states, increased in 34 states and D.C., and was unchanged in Alabama and Virginia. South Carolina lost the most construction jobs over the month (-1,900 jobs, -1.7%), followed by Missouri (-1,500 jobs, -1.2%). The largest percentage decline was in New Hampshire (-2.2%, -600 jobs), followed by Vermont (-2.1%, -300 jobs).
Louisiana added the largest number and percentage of construction jobs between September and October (8,200 jobs, 7.1%). California was second in construction job gains (7,500 jobs, 0.8%), while West Virginia had the second-highest percentage increase (2.3%, 700 jobs).
Association officials cautioned that the Build Back Better measure, which passed in the House earlier today, will undermine the construction sector’s recovery. They noted that the measure’s tax and labor provisions will stifle investments in construction activity and make it even harder for firms to find qualified workers to hire. They urged Senators to reject the massive new spending bill.
“The last thing Washington should be doing is making it even harder for firms to find projects to build or workers to hire,” said Stephen E. Sandherr, the association’s chief executive officer. “Yet the hyper-partisan Build Back Better bill will hobble employers with new mandates even as it stifles private sector demand with new taxes and regulations.”
View state February 2020-October 2021 data and rankings, 1-month rankings.
Related Stories
Market Data | Apr 4, 2018
Construction employment increases in 257 metro areas between February 2017 & 2018 as construction firms continue to expand amid strong demand
Riverside-San Bernardino-Ontario, Calif. and Merced, Calif. experience largest year-over-year gains; Baton Rouge, La. and Auburn-Opelika, Ala. have biggest annual declines in construction employment.
Market Data | Apr 2, 2018
Construction spending in February inches up from January
Association officials urge federal, state and local officials to work quickly to put recently enacted funding increases to work to improve aging and over-burdened infrastructure, offset public-sector spending drops.

Market Data | Mar 29, 2018
AIA and the University of Minnesota partner to develop Guides for Equitable Practice
The Guides for Equitable Practice will be developed and implemented in three phase.

Market Data | Mar 22, 2018
Architecture billings continue to hold positive in 2018
Billings particularly strong at firms in the West and Midwest regions.

Market Data | Mar 21, 2018
Construction employment increases in 248 metro areas as new metal tariffs threaten future sector job gains
Riverside-San Bernardino-Ontario, Calif., and Merced, Calif., experience largest year-over-year gains; Baton Rouge, La., and Auburn-Opelika, Ala., have biggest annual declines in construction employment.
Market Data | Mar 19, 2018
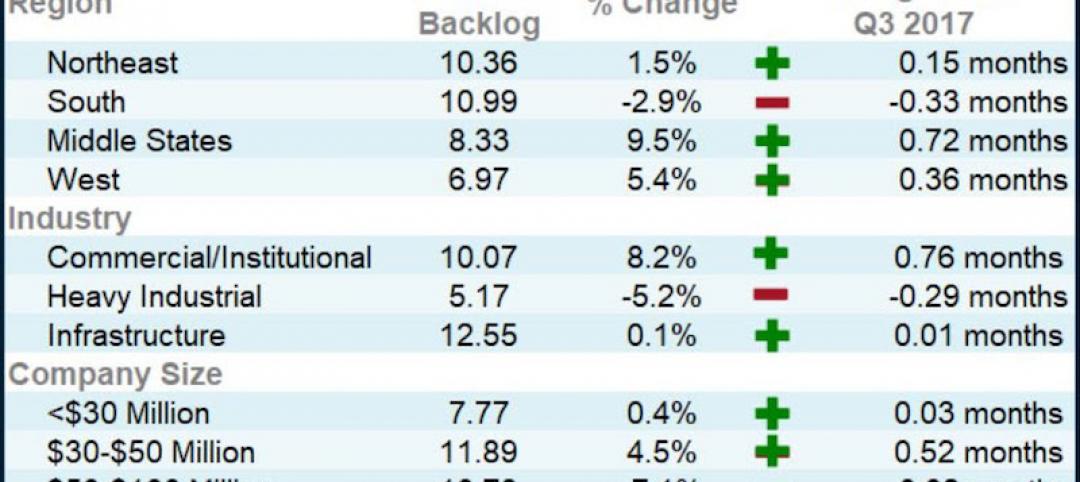
ABC's Construction Backlog Indicator hits a new high: 2018 poised to be a very strong year for construction spending
CBI is up by 1.36 months, or 16.3%, on a year-over-year basis.

Market Data | Mar 15, 2018
ABC: Construction materials prices continue to expand briskly in February
Compared to February 2017, prices are up 5.2%.

Market Data | Mar 14, 2018
AGC: Tariff increases threaten to make many project unaffordable
Construction costs escalated in February, driven by price increases for a wide range of building materials, including steel and aluminum.
Market Data | Mar 12, 2018
Construction employers add 61,000 jobs in February and 254,000 over the year
Hourly earnings rise 3.3% as sector strives to draw in new workers.

Steel Buildings | Mar 9, 2018
New steel and aluminum tariffs will hurt construction firms by raising materials costs; potential trade war will dampen demand, says AGC of America
Independent studies suggest the construction industry could lose nearly 30,000 jobs as a result of administration's new tariffs as many firms will be forced to absorb increased costs.


