

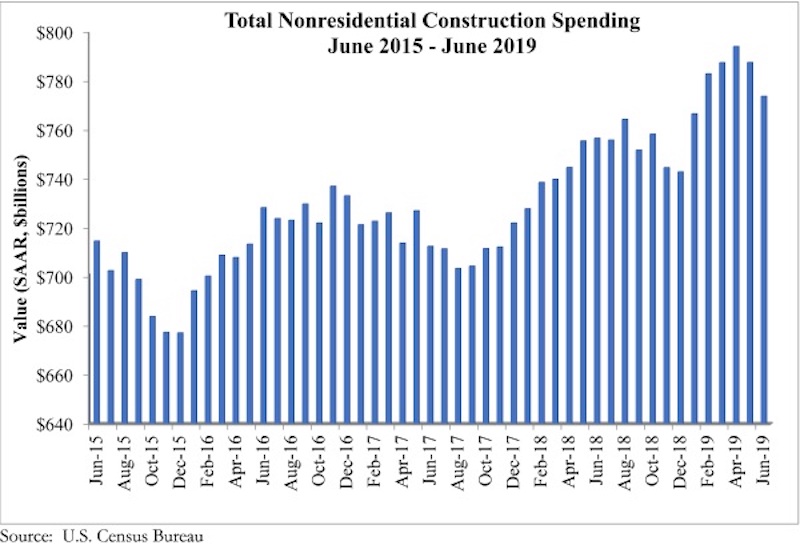
National nonresidential construction spending declined 1.8% in June, totaling $773.8 billion on a seasonally adjusted annualized basis—a 2.3% increase compared to the same time a year ago, according to an Associated Builders and Contractors analysis of U.S. Census Bureau data published today. Public nonresidential spending fell 3.7% in June, but is up 6.4% year over year, while private nonresidential spending fell 0.3% on a monthly basis and is up 0.4% from June 2018.
Among the 16 nonresidential construction spending categories tracked by the Census Bureau, seven experienced increases in monthly spending, although only the conservation and development (+3.8%) and commercial (+1.3%) categories increased by more than 1%. While spending in several categories fell for the month, significant decreases in the publicly driven educational (-6.5%) and highway and street (-6.3%) categories accounted for nearly all of the monthly decline.
“Like the balance of the U.S. economy, nonresidential construction spending appears to be softening, albeit gradually,” said ABC Chief Economist Anirban Basu. “Private nonresidential construction spending has been trending lower for several months, and segments like office and lodging are no longer the drivers of construction spending growth that they had been, likely due to growing concerns about market saturation.
“The dip in public construction may have been merely temporary, which is likely the case given the ongoing strength of state and local government finances.” said Basu. “And with the economy still adding substantial numbers of jobs, wages growing at or near a decade-high pace, consumers continuing to spend and property values remaining stable, local and state governments should continue to experience solid income, retail and real estate tax collections. All things being equal, that should help fuel infrastructure outlays, especially given still very low borrowing costs.
“While many observers continue to focus on issues such as trade disputes, high levels of corporate debt and asset prices that are susceptible to sharp declines, the U.S. construction industry’s most significant source of uncertainty may be the pending insolvency of the Highway Trust Fund,” said Basu. “That insolvency is now a mere two years away, and if policymakers fail to act expeditiously, state and local policymakers may choose to postpone certain projects given the rising uncertainty of federal funding. The highway/street and transportation categories are especially vulnerable to such dynamics.”


Related Stories

Data Centers | Jan 28, 2016
Top 10 markets for data center construction
JLL’s latest outlook foresees a maturation in certain metros.

Market Data | Jan 20, 2016
Nonresidential building starts sag in 2015
CDM Research finds only a few positive signs among the leading sectors.
Market Data | Jan 20, 2016
Architecture Billings Index ends year on positive note
While volatility persists, architecture firms reported healthy performance for 2015.

Market Data | Jan 15, 2016
ABC: Construction material prices continue free fall in December
In December, construction material prices fell for the sixth consecutive month. Prices have declined 7.2% since peaking in August 2014.

Market Data | Jan 13, 2016
Morgan Stanley bucks gloom and doom, thinks U.S. economy has legs through 2020
Strong job growth and dwindling consumer debt give rise to hope.

Hotel Facilities | Jan 13, 2016
Hotel construction should remain strong through 2017
More than 100,000 rooms could be delivered this year alone.

Market Data | Jan 6, 2016
Census Bureau revises 10 years’ worth of construction spending figures
The largest revisions came in the last two years and were largely upward.

Market Data | Jan 5, 2016
Majority of AEC firms saw growth in 2015, remain optimistic for 2016: BD+C survey
By all indications, 2015 was another solid year for U.S. architecture, engineering, and construction firms.

Market Data | Jan 5, 2016
Nonresidential construction spending falters in November
Only 4 of 16 subsectors showed gains

Market Data | Dec 15, 2015
AIA: Architecture Billings Index hits another bump
Business conditions show continued strength in South and West regions.


