

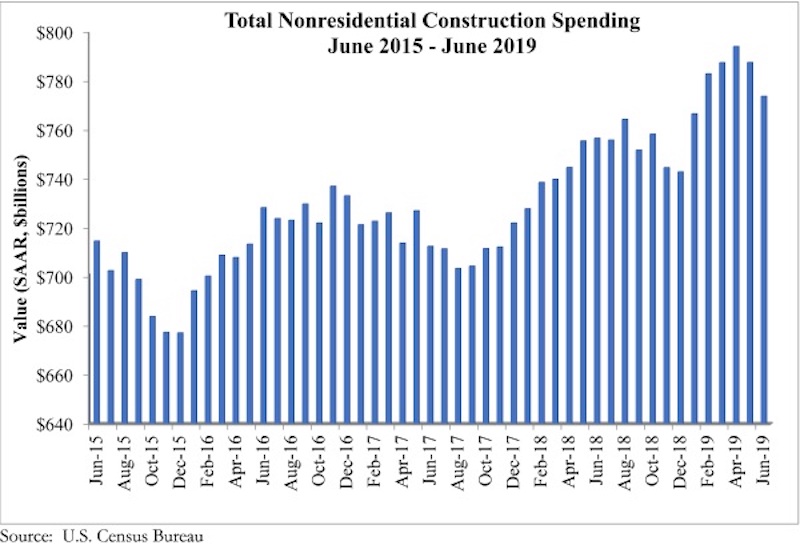
National nonresidential construction spending declined 1.8% in June, totaling $773.8 billion on a seasonally adjusted annualized basis—a 2.3% increase compared to the same time a year ago, according to an Associated Builders and Contractors analysis of U.S. Census Bureau data published today. Public nonresidential spending fell 3.7% in June, but is up 6.4% year over year, while private nonresidential spending fell 0.3% on a monthly basis and is up 0.4% from June 2018.
Among the 16 nonresidential construction spending categories tracked by the Census Bureau, seven experienced increases in monthly spending, although only the conservation and development (+3.8%) and commercial (+1.3%) categories increased by more than 1%. While spending in several categories fell for the month, significant decreases in the publicly driven educational (-6.5%) and highway and street (-6.3%) categories accounted for nearly all of the monthly decline.
“Like the balance of the U.S. economy, nonresidential construction spending appears to be softening, albeit gradually,” said ABC Chief Economist Anirban Basu. “Private nonresidential construction spending has been trending lower for several months, and segments like office and lodging are no longer the drivers of construction spending growth that they had been, likely due to growing concerns about market saturation.
“The dip in public construction may have been merely temporary, which is likely the case given the ongoing strength of state and local government finances.” said Basu. “And with the economy still adding substantial numbers of jobs, wages growing at or near a decade-high pace, consumers continuing to spend and property values remaining stable, local and state governments should continue to experience solid income, retail and real estate tax collections. All things being equal, that should help fuel infrastructure outlays, especially given still very low borrowing costs.
“While many observers continue to focus on issues such as trade disputes, high levels of corporate debt and asset prices that are susceptible to sharp declines, the U.S. construction industry’s most significant source of uncertainty may be the pending insolvency of the Highway Trust Fund,” said Basu. “That insolvency is now a mere two years away, and if policymakers fail to act expeditiously, state and local policymakers may choose to postpone certain projects given the rising uncertainty of federal funding. The highway/street and transportation categories are especially vulnerable to such dynamics.”


Related Stories

Market Data | May 2, 2017
Nonresidential Spending loses steam after strong start to year
Spending in the segment totaled $708.6 billion on a seasonally adjusted, annualized basis.

Market Data | May 1, 2017
Nonresidential Fixed Investment surges despite sluggish economic in first quarter
Real gross domestic product (GDP) expanded 0.7 percent on a seasonally adjusted annualized rate during the first three months of the year.

Industry Research | Apr 28, 2017
A/E Industry lacks planning, but still spending large on hiring
The average 200-person A/E Firm is spending $200,000 on hiring, and not budgeting at all.

Market Data | Apr 19, 2017
Architecture Billings Index continues to strengthen
Balanced growth results in billings gains in all regions.

Market Data | Apr 13, 2017
2016’s top 10 states for commercial development
Three new states creep into the top 10 while first and second place remain unchanged.

Market Data | Apr 6, 2017
Architecture marketing: 5 tools to measure success
We’ve identified five architecture marketing tools that will help your firm evaluate if it’s on the track to more leads, higher growth, and broader brand visibility.

Market Data | Apr 3, 2017
Public nonresidential construction spending rebounds; overall spending unchanged in February
The segment totaled $701.9 billion on a seasonally adjusted annualized rate for the month, marking the seventh consecutive month in which nonresidential spending sat above the $700 billion threshold.

Market Data | Mar 29, 2017
Contractor confidence ends 2016 down but still in positive territory
Although all three diffusion indices in the survey fell by more than five points they remain well above the threshold of 50, which signals that construction activity will continue to be one of the few significant drivers of economic growth.

Market Data | Mar 24, 2017
These are the most and least innovative states for 2017
Connecticut, Virginia, and Maryland are all in the top 10 most innovative states, but none of them were able to claim the number one spot.

Market Data | Mar 22, 2017
After a strong year, construction industry anxious about Washington’s proposed policy shifts
Impacts on labor and materials costs at issue, according to latest JLL report.


