


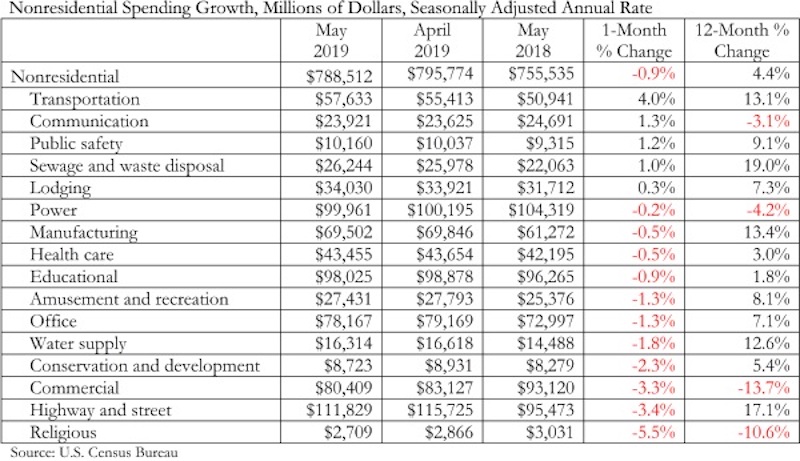
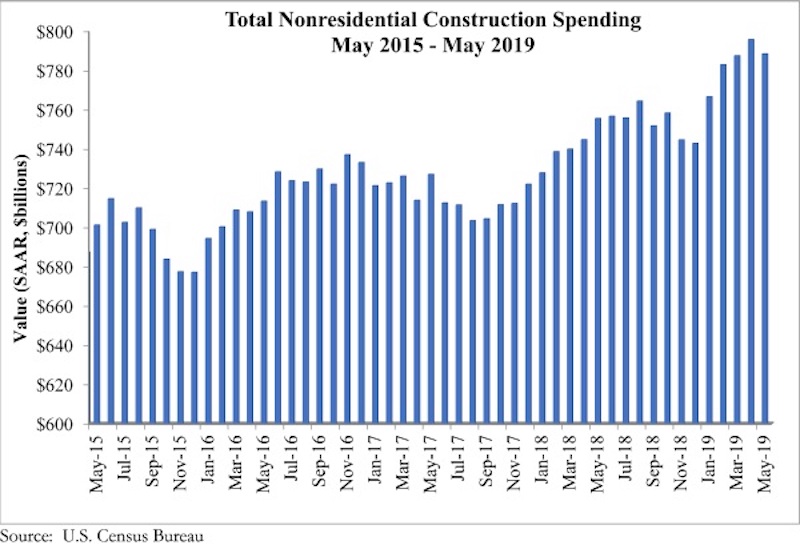
According to an Associated Builders and Contractors analysis of U.S. Census Bureau data published today, national nonresidential construction spending declined 0.9% in May, totaling $788.5 billion on a seasonally adjusted annualized basis and a 4.4% increase compared to the same time last year. While total public and private nonresidential spending declined 0.9% since April, public spending was up 11.2% and private spending was down 0.1% year over year.
Among the 16 nonresidential construction spending categories tracked by the Census Bureau, five experienced increases in monthly spending, including transportation (4%), communication (1.3%) and public safety (1.2%). Religious (-5.5%), commercial (-3.3%) and highway and street (-3.4%) experienced the largest monthly decreases, although highway and street spending remained up 17.1% compared to May 2018. Total construction spending is down 2.3% compared to the same time last year, and residential spending is down sharply.
“Private construction spending has been slipping for several months,” said ABC Chief Economist Anirban Basu. “Commercial construction spending decreased nearly 14% during the past year, which represents a stark reversal from previous trends when America’s consumer-spending-led expansion produced substantial demand for commercial construction. That said, commercial spending is up 102% compared to May 2010. Other private construction categories such as office and lodging have also been weak as rising construction and capital costs render pro formas more problematic. There are also growing concerns regarding overbuilding in certain segments/markets.
“What was different about today’s release was the decline in public construction spending,” said Basu. “While the drop was reasonably small on a monthly basis, it stands in stark contrast to the preexisting trend. With the economic expansion entering its record 11th year, state and local government finances are generally in good shape, leaving more money to spend on infrastructure. Based on broad economic dynamics and fiscal considerations, there is little reason to believe that the dip in May portends a slowdown in infrastructure spending during the months ahead.”
Related Stories
Market Data | Feb 2, 2022
Majority of metro areas added construction jobs in 2021
Soaring job openings indicate that labor shortages are only getting worse.
Market Data | Feb 2, 2022
Construction spending increased in December for the month and the year
Nonresidential and public construction lagged residential sector.

Market Data | Jan 31, 2022
Canada's hotel construction pipeline ends 2021 with 262 projects and 35,325 rooms
At the close of 2021, projects under construction stand at 62 projects/8,100 rooms.

Market Data | Jan 27, 2022
Record high counts for franchise companies in the early planning stage at the end of Q4'21
Through year-end 2021, Marriott, Hilton, and IHG branded hotels represented 585 new hotel openings with 73,415 rooms.

Market Data | Jan 27, 2022
Dallas leads as the top market by project count in the U.S. hotel construction pipeline at year-end 2021
The market with the greatest number of projects already in the ground, at the end of the fourth quarter, is New York with 90 projects/14,513 rooms.

Market Data | Jan 26, 2022
2022 construction forecast: Healthcare, retail, industrial sectors to lead ‘healthy rebound’ for nonresidential construction
A panel of construction industry economists forecasts 5.4 percent growth for the nonresidential building sector in 2022, and a 6.1 percent bump in 2023.

Market Data | Jan 24, 2022
U.S. hotel construction pipeline stands at 4,814 projects/581,953 rooms at year-end 2021
Projects scheduled to start construction in the next 12 months stand at 1,821 projects/210,890 rooms at the end of the fourth quarter.

Market Data | Jan 19, 2022
Architecture firms end 2021 on a strong note
December’s Architectural Billings Index (ABI) score of 52.0 was an increase from 51.0 in November.

Market Data | Jan 13, 2022
Materials prices soar 20% in 2021 despite moderating in December
Most contractors in association survey list costs as top concern in 2022.

Market Data | Jan 12, 2022
Construction firms forsee growing demand for most types of projects
Seventy-four percent of firms plan to hire in 2022 despite supply-chain and labor challenges.


