

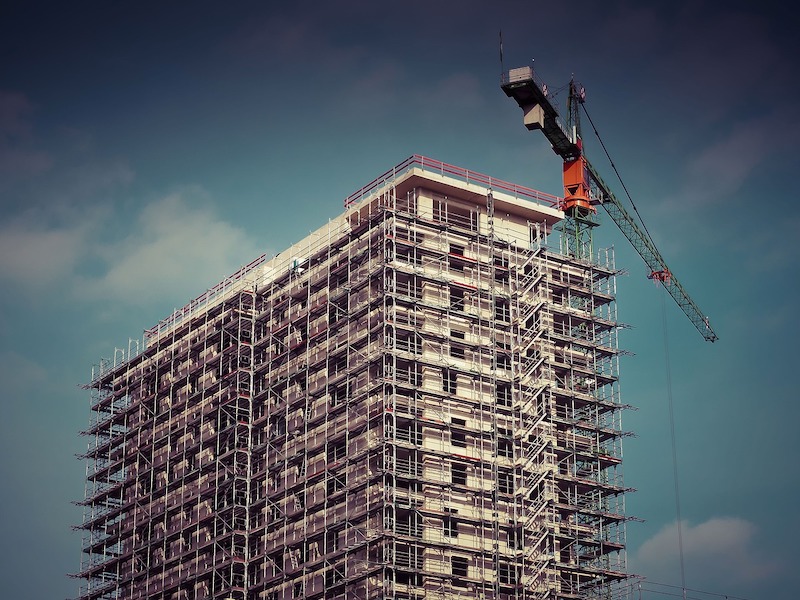
The construction industry’s fortunes continued to diverge in October, as residential construction expanded again while nonresidential construction remained largely unchanged from a month ago and is down compared to last year, according to an analysis of new federal construction spending data by the Associated General Contractors of America. Association officials said that demand for nonresidential construction is being hit by private sector worries about the coronavirus, tighter state and local budgets and the lack of new federal pandemic relief measures.
“The October spending report shows private nonresidential construction is continuing to slide,” said Ken Simonson, the association’s chief economist. “Public construction spending has fluctuated in recent months but both types of nonresidential spending have fallen significantly from recent peaks this year and appear to be heading even lower.”
Construction spending in October totaled $1.44 trillion at a seasonally adjusted annual rate, an increase of 1.3% from the pace in September and 3.7% higher than in October 2019. But the gains were limited to residential construction, which increased 2.9% for the month and 14.6% year-over-year. Meanwhile, private and public nonresidential spending was virtually unchanged from September and declined 3.7% from a year earlier.
Private nonresidential construction spending declined for the fourth month in a row, slipping 0.7% from September to October, with decreases in nine out of 11 categories. The October total was 8.2% lower than in October 2019. The largest private nonresidential segment, power construction, declined 0.8% for the month. Among the other large private nonresidential project types, commercial construction—comprising retail, warehouse and farm structures—slid 1.0%, manufacturing construction declined 0.8%, and office construction dipped 0.2%.
Public construction spending increased 1.0% in October and 3.7% year-over-year. The largest public category, highway and street construction, gained 1.6% for the month. Among other large public segments, educational construction increased 1.1% for the month and transportation construction rose 1.0%.
Private residential construction spending increased for the fifth consecutive month, rising 2.9% in October. Single-family homebuilding jumped 5.6% for the month, while multifamily construction spending rose 1.2% and residential improvements spending was flat.
Association officials said demand for nonresidential construction was unlikely to rebound in the near-term without new federal relief measures, putting additional construction careers at risk. These should include new investments in infrastructure, to improve aging roads and bridges, public buildings and water utility networks. Federal officials should refrain from taxing Paycheck Protection Program loans as it would undermine the benefits of that program. And Congress and the administration should work together to enact liability reforms to protect honest firms from frivolous coronavirus lawsuits.
“As long as the coronavirus undermines private sector confidence and public sector budgets, the only way to save good-paying construction careers is through new federal relief measures,” said Stephen E. Sandherr, the association’s chief executive officer. “Fixing the nation’s infrastructure, preserving the benefits of the PPP program and protecting honest employers will give the economy a much-needed short-term boost.”
Related Stories

Market Data | Mar 29, 2017
Contractor confidence ends 2016 down but still in positive territory
Although all three diffusion indices in the survey fell by more than five points they remain well above the threshold of 50, which signals that construction activity will continue to be one of the few significant drivers of economic growth.

Market Data | Mar 24, 2017
These are the most and least innovative states for 2017
Connecticut, Virginia, and Maryland are all in the top 10 most innovative states, but none of them were able to claim the number one spot.

Market Data | Mar 22, 2017
After a strong year, construction industry anxious about Washington’s proposed policy shifts
Impacts on labor and materials costs at issue, according to latest JLL report.

Market Data | Mar 22, 2017
Architecture Billings Index rebounds into positive territory
Business conditions projected to solidify moving into the spring and summer.

Market Data | Mar 15, 2017
ABC's Construction Backlog Indicator fell to end 2016
Contractors in each segment surveyed all saw lower backlog during the fourth quarter, with firms in the heavy industrial segment experiencing the largest drop.

Market Data | Feb 28, 2017
Leopardo’s 2017 Construction Economics Report shows year-over-year construction spending increase of 4.2%
The pace of growth was slower than in 2015, however.

Market Data | Feb 23, 2017
Entering 2017, architecture billings slip modestly
Despite minor slowdown in overall billings, commercial/ industrial and institutional sectors post strongest gains in over 12 months.

Market Data | Feb 16, 2017
How does your hospital stack up? Grumman/Butkus Associates 2016 Hospital Benchmarking Survey
Report examines electricity, fossil fuel, water/sewer, and carbon footprint.

Market Data | Feb 1, 2017
Nonresidential spending falters slightly to end 2016
Nonresidential spending decreased from $713.1 billion in November to $708.2 billion in December.

Market Data | Jan 31, 2017
AIA foresees nonres building spending increasing, but at a slower pace than in 2016
Expects another double-digit growth year for office construction, but a more modest uptick for health-related building.


