flexiblefullpage -
billboard - default
interstitial1 - interstitial
catfish1 - bottom
Currently Reading

Nonresidential construction spending falters in November

Market Data

Nonresidential construction spending falters in November

Only 4 of 16 subsectors showed gains


By John Caulfield, Senior Editor | January 5, 2016

The latter months of 2015 showed signs that construction spending's momentum had leveled off. Courtesy of Pixabay

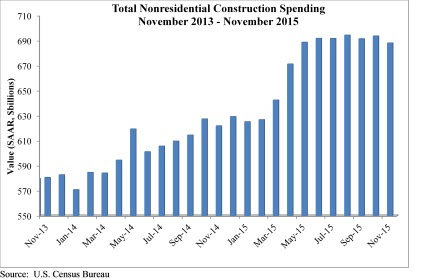
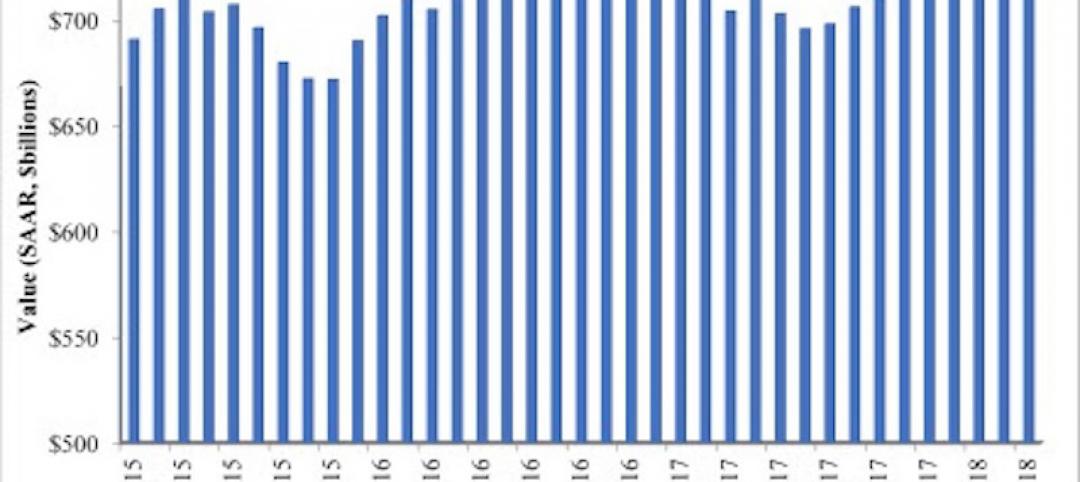
Spending for nonresidential construction, which had been on the uptick for most of 2015, stumbled in the latter months. 

The Census Bureau revised downward its spending estimates for September and October, and reported that spending in November stood at a seasonally adjusted annualized rate of $688.1 billion, down 0.8% from the lower October figure. 
 
Even though it was still up from November 2014's annualized rate of around $625 billion, November 2015 was the industry's worst-performing month since April 2015. 
 
Anirban Basu, chief economist for Associated Builders and Contractors (ABC), called Census's latest data “ominous,” because it showed that spending momentum “has softened considerably in recent months.” He added that ABC's surveys of construction executives paint a more dire picture of the industry's state.


“The most recent data suggest that while 2016 may be a year of nonresidential construction spending growth, it may not provide the degree of momentum that characterized much of 2015,” Basu said. He pointed specifically to construction related to the manufacturing sector, which in November was off 28.8% from November 2014. He believes this downturn reflects falling exports and stiffer competition from foreign producers.
 
ABC's analysis of Census's data found that only four of 16 construction subsectors showed positive gains in November: Communication, which was up 4.4% over October and 27.8% over November 2014; Education (up 3.9% and 13.8%), Office (1.6% and 20.5%), and Transportation (0.2% and 3.1%).
 
Conversely, spending for Public Safety projects fell 8.1% on a monthly basis, and 5.2% year over year. Even Healthcare, which had been the industry's shining light recently (it was up 5% from November 2014), slipped by 0.1% from October 2015.

Related Stories

Market Data | Jun 26, 2018

Yardi Matrix examines potential regional multifamily supply overload

Outsize development activity in some major metros could increase vacancy rates and stagnate rent growth.

Market Data | Jun 22, 2018

Multifamily market remains healthy – Can it be sustained?

New report says strong economic fundamentals outweigh headwinds.

Market Data | Jun 21, 2018

Architecture firm billings strengthen in May

Architecture Billings Index enters eighth straight month of solid growth.

Market Data | Jun 20, 2018

7% year-over-year growth in the global construction pipeline

There are 5,952 projects/1,115,288 rooms under construction, up 8% by projects YOY. 

Market Data | Jun 19, 2018

ABC’s Construction Backlog Indicator remains elevated in first quarter of 2018

The CBI shows highlights by region, industry, and company size.

Market Data | Jun 19, 2018

America’s housing market still falls short of providing affordable shelter to many

The latest report from the Joint Center for Housing Studies laments the paucity of subsidies to relieve cost burdens of ownership and renting.

Market Data | Jun 18, 2018

AI is the path to maximum profitability for retail and FMCG firms

Leading retailers including Amazon, Alibaba, Lowe’s and Tesco are developing their own AI solutions for automation, analytics and robotics use cases. 

Market Data | Jun 12, 2018

Yardi Matrix report details industrial sector's strength

E-commerce and biopharmaceutical companies seeking space stoke record performances across key indicators.

Market Data | Jun 8, 2018

Dodge Momentum Index inches up in May

May’s gain was the result of a 4.7% increase by the commercial component of the Momentum Index.

Market Data | Jun 4, 2018

Nonresidential construction remains unchanged in April

Private sector spending increased 0.8% on a monthly basis and is up 5.3% from a year ago.

boombox1 - default
boombox2 -
native1 -

More In Category

Construction Costs

New download: BD+C's May 2024 Market Intelligence Report

Building Design+Construction's monthly Market Intelligence Report offers a snapshot of the health of the U.S. building construction industry, including the commercial, multifamily, institutional, and industrial building sectors. This report tracks the latest metrics related to construction spending, demand for design services, contractor backlogs, and material price trends.


halfpage1 -

Most Popular Content

  1. 2021 Giants 400 Report
  2. Top 150 Architecture Firms for 2019
  3. 13 projects that represent the future of affordable housing
  4. Sagrada Familia completion date pushed back due to coronavirus
  5. Top 160 Architecture Firms 2021