


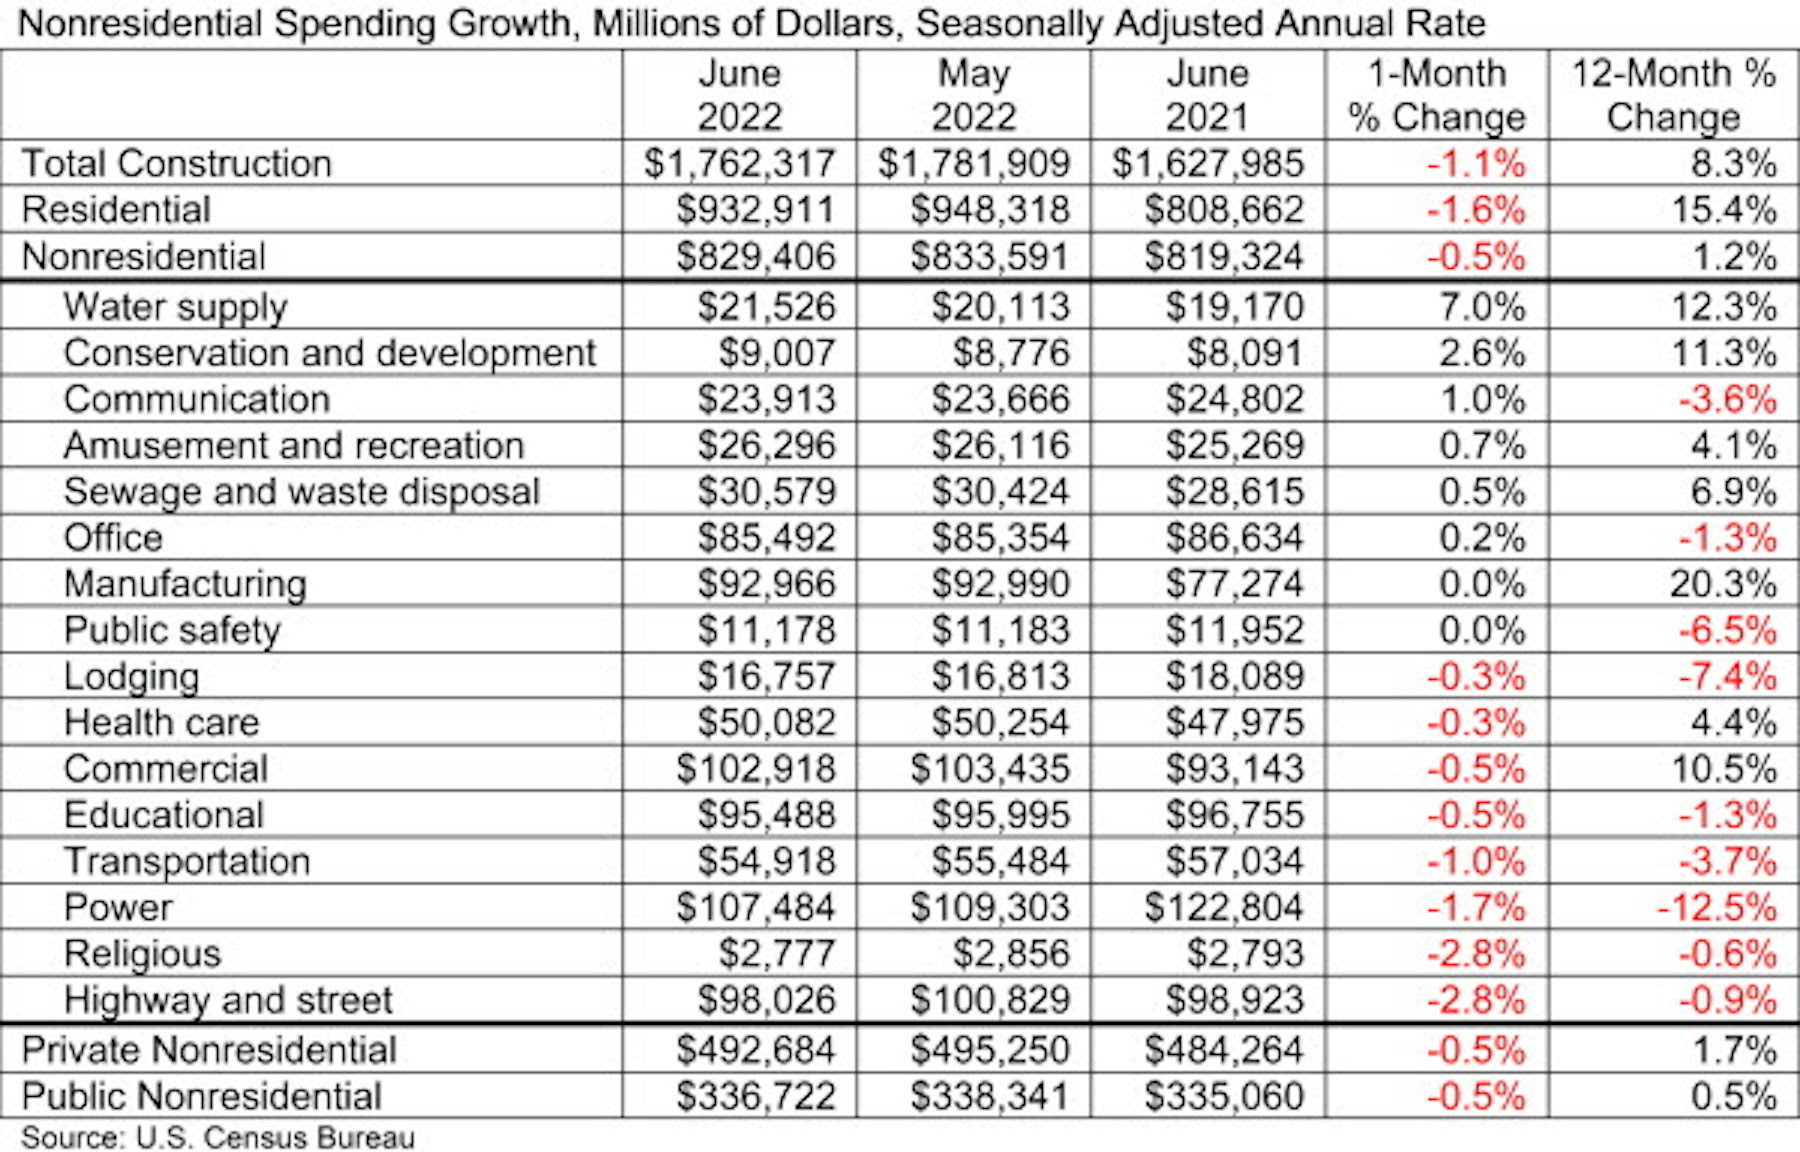
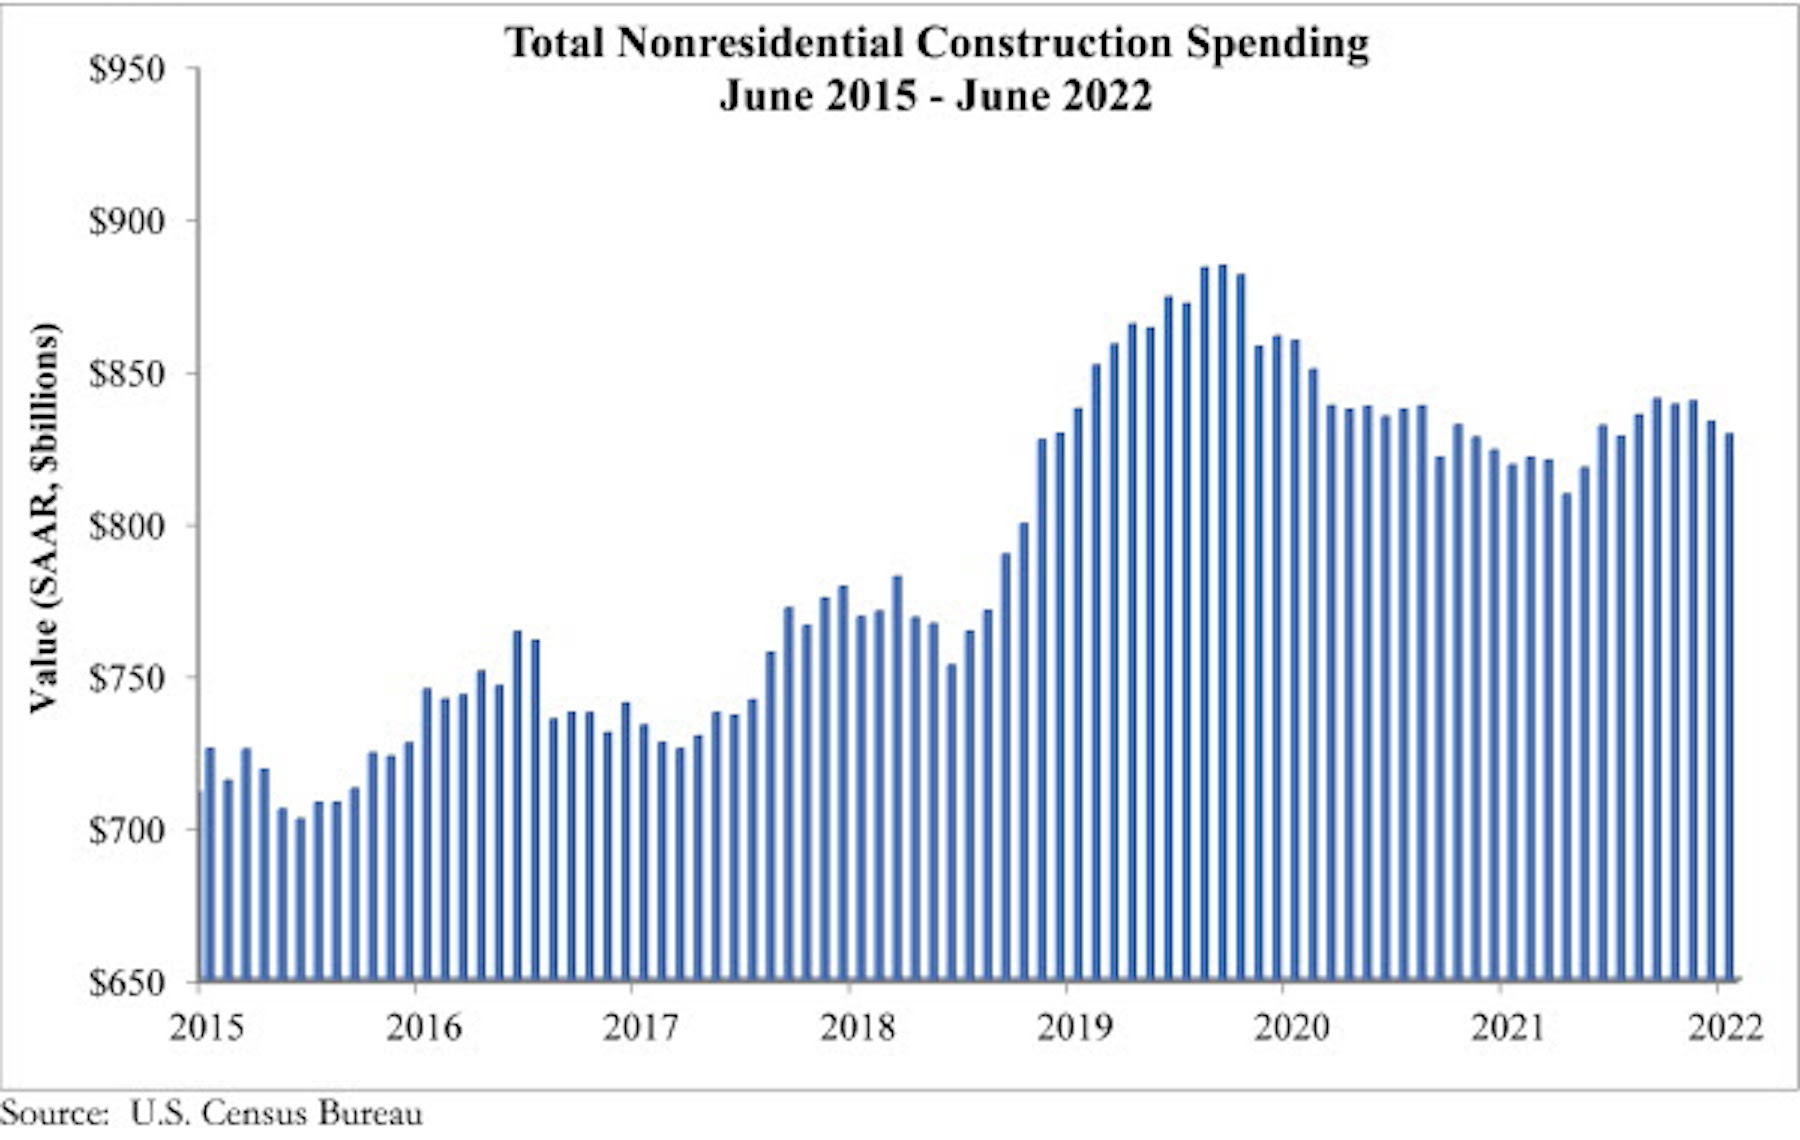
National nonresidential construction spending was down by 0.5% in June, according to an Associated Builders and Contractors analysis of data published today by the U.S. Census Bureau. On a seasonally adjusted annualized basis, nonresidential spending totaled $829.4 billion for the month.
Spending was down on a monthly basis in eight of the 16 nonresidential subcategories. Both private and public nonresidential spending fell by 0.5% in June.
“There continues to be significant downward pressure on nonresidential construction spending volumes, and that is likely to intensify going forward,” said ABC Chief Economist Anirban Basu. “To date, construction spending measured in dollars has been propped up by elevated construction delivery costs, including higher materials prices and rapidly rising wages. Despite those inflationary pressures, aggregate nonresidential construction spending has failed to recover to pre-pandemic levels in nominal terms. The situation looks even worse when adjusting for inflation.
“The primary issue is that those high construction delivery charges are inducing a significant fraction of project owners to reconsider start dates,” said Basu. “True, backlog remains elevated, according to ABC’s Construction Backlog Indicator, but this may be because it is taking longer to complete projects. Additional project delays and cancellations are likely as borrowing costs continue to ratchet higher for those who purchase construction services and as the risk of recession increases. For now, many contractors remain busy and continue to operate at or near capacity. Whether that will continue for another 12 to 18 months remains an unanswered question.”
Related Stories

Industry Research | Apr 28, 2017
A/E Industry lacks planning, but still spending large on hiring
The average 200-person A/E Firm is spending $200,000 on hiring, and not budgeting at all.

Market Data | Apr 19, 2017
Architecture Billings Index continues to strengthen
Balanced growth results in billings gains in all regions.

Market Data | Apr 13, 2017
2016’s top 10 states for commercial development
Three new states creep into the top 10 while first and second place remain unchanged.

Market Data | Apr 6, 2017
Architecture marketing: 5 tools to measure success
We’ve identified five architecture marketing tools that will help your firm evaluate if it’s on the track to more leads, higher growth, and broader brand visibility.

Market Data | Apr 3, 2017
Public nonresidential construction spending rebounds; overall spending unchanged in February
The segment totaled $701.9 billion on a seasonally adjusted annualized rate for the month, marking the seventh consecutive month in which nonresidential spending sat above the $700 billion threshold.

Market Data | Mar 29, 2017
Contractor confidence ends 2016 down but still in positive territory
Although all three diffusion indices in the survey fell by more than five points they remain well above the threshold of 50, which signals that construction activity will continue to be one of the few significant drivers of economic growth.

Market Data | Mar 24, 2017
These are the most and least innovative states for 2017
Connecticut, Virginia, and Maryland are all in the top 10 most innovative states, but none of them were able to claim the number one spot.

Market Data | Mar 22, 2017
After a strong year, construction industry anxious about Washington’s proposed policy shifts
Impacts on labor and materials costs at issue, according to latest JLL report.

Market Data | Mar 22, 2017
Architecture Billings Index rebounds into positive territory
Business conditions projected to solidify moving into the spring and summer.

Market Data | Mar 15, 2017
ABC's Construction Backlog Indicator fell to end 2016
Contractors in each segment surveyed all saw lower backlog during the fourth quarter, with firms in the heavy industrial segment experiencing the largest drop.


