


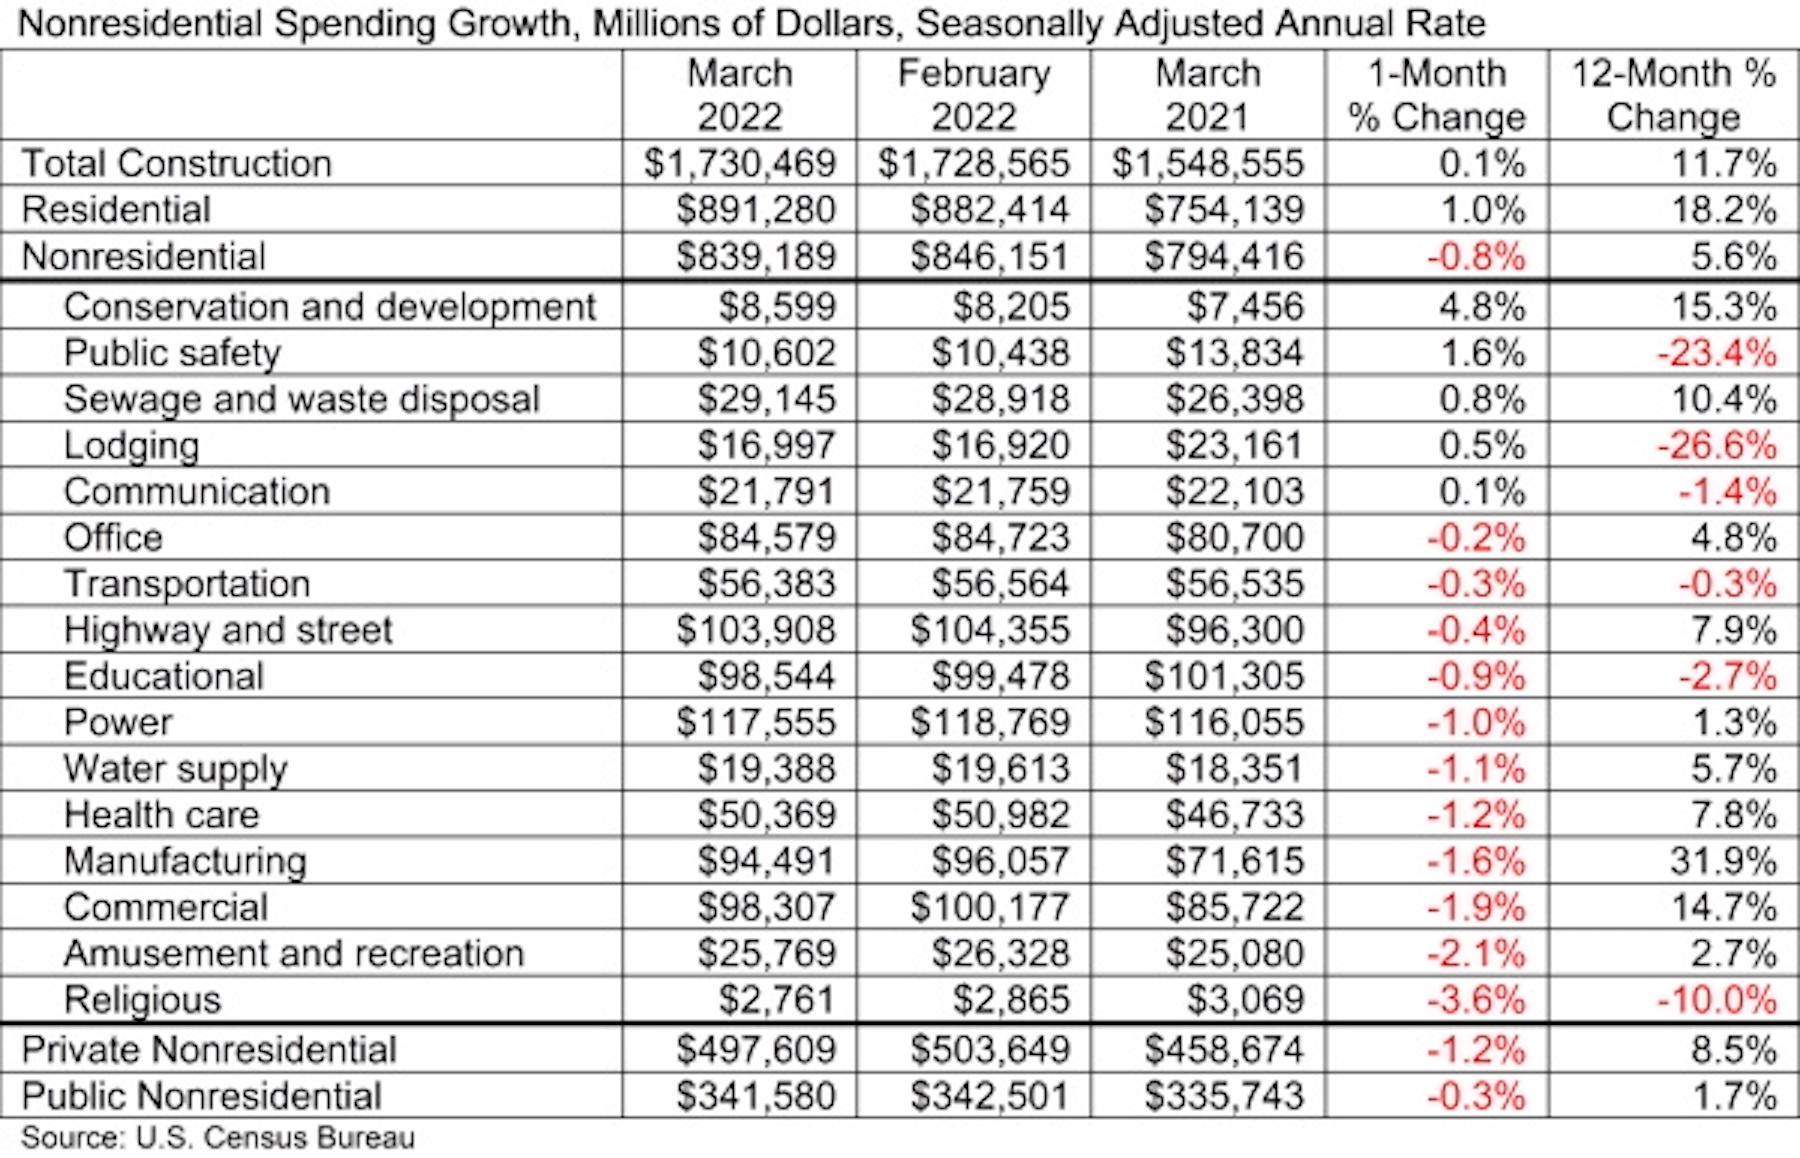
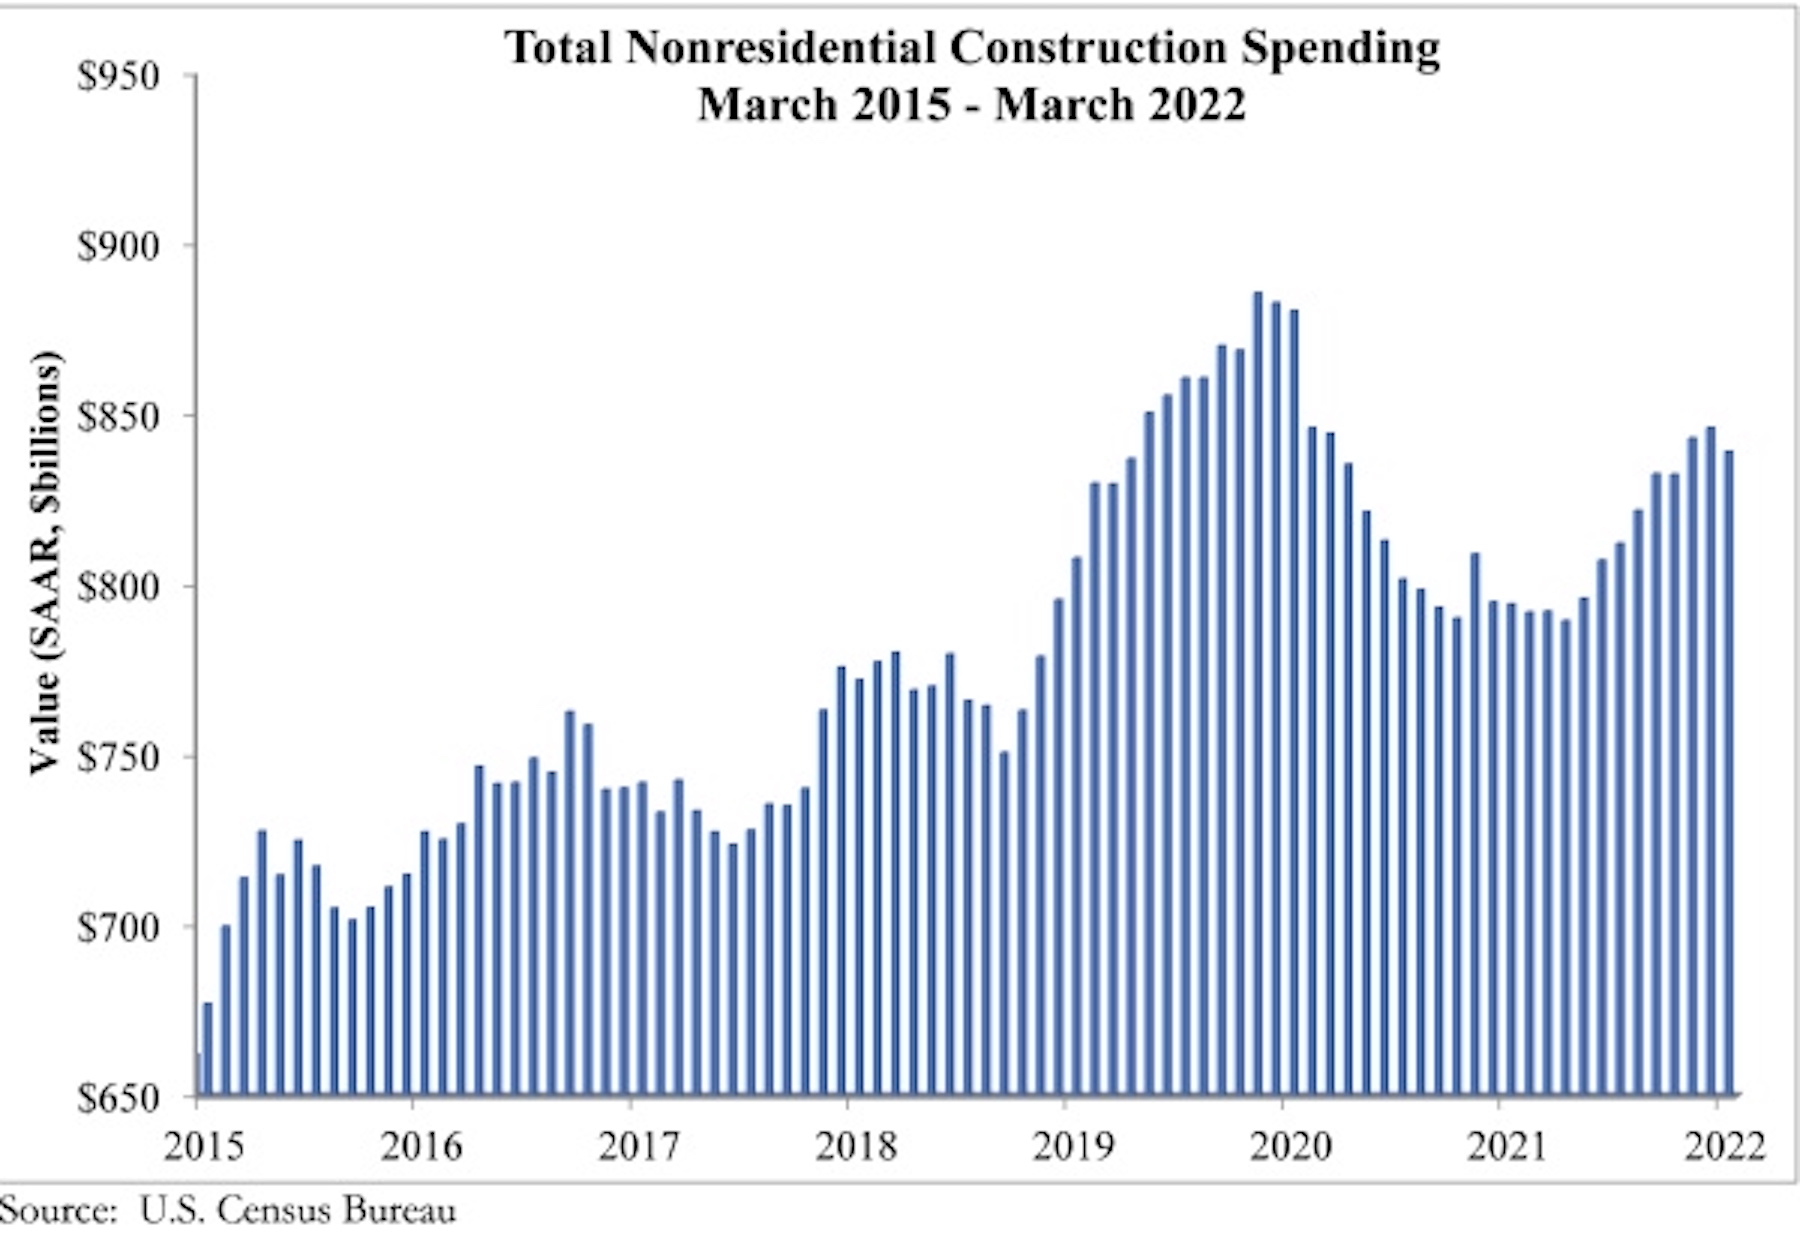
National nonresidential construction spending was down 0.8% in March, according to an Associated Builders and Contractors analysis of data published today by the U.S. Census Bureau. On a seasonally adjusted annualized basis, nonresidential spending totaled $839.2 billion for the month.
Spending was down on a monthly basis in 11 of 16 nonresidential subcategories. Private nonresidential spending was down 1.2%, while public nonresidential construction spending was down 0.3% in March. On a year-over-year basis, nonresidential construction spending is up 5.6%, led by 31.9% growth in construction related to manufacturing.
“March’s construction spending numbers aren’t adjusted for inflation and are actually worse than they look,” said ABC Chief Economist Anirban Basu. “While overall construction spending rose 0.1% in March, largely because of the strength in multifamily residential construction, construction spending was down in real terms. Nonresidential construction performance declined because of weakness in segments like commercial (-1.9%) and amusement/recreation (-2.1%).
“Even though nonresidential construction spending levels are significantly short of what they were pre-pandemic, many contractors indicate that they are operating at capacity, according to ABC’s Construction Backlog Indicator,” said Basu. “This speaks to how challenging the economic environment is becoming, with contractors wrestling with workforce skills shortages and sky-high materials prices. The elevated cost of construction service delivery helps explain why more projects are not moving forward as project owners are forced to wait.
“Circumstances could become easier or more challenging for contractors during the months ahead,” said Basu. “The Federal Reserve’s stepped-up efforts to combat inflation will eventually translate into better pricing for key construction inputs. However, those same efforts will soften the economy. Many economists believe that a recession in America over the next 12 to 18 months has become virtually inevitable. Thus, even as delivering construction services becomes more affordable, demand for construction services, particularly private construction, may begin to fade.”
Related Stories

Industry Research | Apr 28, 2017
A/E Industry lacks planning, but still spending large on hiring
The average 200-person A/E Firm is spending $200,000 on hiring, and not budgeting at all.

Market Data | Apr 19, 2017
Architecture Billings Index continues to strengthen
Balanced growth results in billings gains in all regions.

Market Data | Apr 13, 2017
2016’s top 10 states for commercial development
Three new states creep into the top 10 while first and second place remain unchanged.

Market Data | Apr 6, 2017
Architecture marketing: 5 tools to measure success
We’ve identified five architecture marketing tools that will help your firm evaluate if it’s on the track to more leads, higher growth, and broader brand visibility.

Market Data | Apr 3, 2017
Public nonresidential construction spending rebounds; overall spending unchanged in February
The segment totaled $701.9 billion on a seasonally adjusted annualized rate for the month, marking the seventh consecutive month in which nonresidential spending sat above the $700 billion threshold.

Market Data | Mar 29, 2017
Contractor confidence ends 2016 down but still in positive territory
Although all three diffusion indices in the survey fell by more than five points they remain well above the threshold of 50, which signals that construction activity will continue to be one of the few significant drivers of economic growth.

Market Data | Mar 24, 2017
These are the most and least innovative states for 2017
Connecticut, Virginia, and Maryland are all in the top 10 most innovative states, but none of them were able to claim the number one spot.

Market Data | Mar 22, 2017
After a strong year, construction industry anxious about Washington’s proposed policy shifts
Impacts on labor and materials costs at issue, according to latest JLL report.

Market Data | Mar 22, 2017
Architecture Billings Index rebounds into positive territory
Business conditions projected to solidify moving into the spring and summer.

Market Data | Mar 15, 2017
ABC's Construction Backlog Indicator fell to end 2016
Contractors in each segment surveyed all saw lower backlog during the fourth quarter, with firms in the heavy industrial segment experiencing the largest drop.


