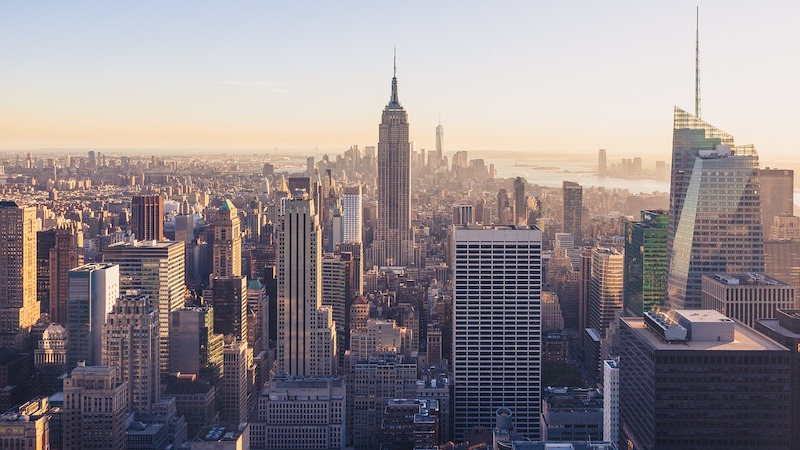
In the recent U.S. Construction Pipeline Trend Report released by Lodging Econometrics (LE), at the close the fourth quarter of 2020 and after more than 6 quarters since leading all U.S. markets in the number of pipeline projects, New York City has regained top billing again with 150 projects/25,640 rooms. Other U.S. markets that follow are Los Angeles with 148 projects/24,808 rooms; Dallas with 147 projects/17,756 rooms; Atlanta with 140 projects/19,863 rooms, recording a record-high number of rooms; and Orlando with 112 projects/19,764 rooms, a record-high pipeline project count for the market.
New York City has the greatest number of projects under construction with 108 projects/19,439 rooms and also the highest number of construction starts in the fourth quarter with 14 projects/2,617 rooms. Following New York City with the highest number of projects under construction is Atlanta with 46 projects/6,728 rooms, and then Los Angeles with 40 projects/7,131 rooms; Dallas with 39 projects/4,656 rooms; and Austin with 33 projects/4,850 rooms.
Despite the impact COVID-19 has had on hotel development, there are four markets in the U.S. that announced more than 10 new construction projects in Q4 ’20. Those markets include Miami with 18 projects accounting for 2,756 rooms, Orlando with 18 projects/4,806 rooms, New York with 17 projects/2,700 rooms, and Atlanta with 11 projects/1,843 rooms.
LE has also seen an increase in announced renovation and brand conversion activity throughout the last few quarters. At year-end 2020, there were 1,308 projects/210,124 rooms in the U.S. undergoing a renovation or conversion. Of the 1,308 renovation and conversion projects, 625 of those are in the top 50 markets. There are nine markets in the U.S. that currently have more than 20 renovation and conversion projects underway. That is led by Los Angeles with 28 projects, followed by Phoenix, Washington DC, Houston, Atlanta, Dallas, Chicago, New York, and Norfolk.
The top 50 markets saw 399 hotels/52,581 rooms open in 2020. LE is forecasting these same 50 markets to open another 509 projects/66,475 rooms in 2021, and 575 projects/71,025 rooms in 2022.
Related Stories
Market Data | Feb 4, 2016
Mortenson: Nonresidential construction costs expected to increase in six major metros
The Construction Cost Index, from Mortenson Construction, indicated rises between 3 and 4% on average.
Contractors | Feb 1, 2016
ABC: Tepid GDP growth a sign construction spending may sputter
Though the economy did not have a strong ending to 2015, the data does not suggest that nonresidential construction spending is set to decline.
Data Centers | Jan 28, 2016
Top 10 markets for data center construction
JLL’s latest outlook foresees a maturation in certain metros.
Market Data | Jan 20, 2016
Nonresidential building starts sag in 2015
CDM Research finds only a few positive signs among the leading sectors.
Market Data | Jan 20, 2016
Architecture Billings Index ends year on positive note
While volatility persists, architecture firms reported healthy performance for 2015.
Market Data | Jan 15, 2016
ABC: Construction material prices continue free fall in December
In December, construction material prices fell for the sixth consecutive month. Prices have declined 7.2% since peaking in August 2014.
Market Data | Jan 13, 2016
Morgan Stanley bucks gloom and doom, thinks U.S. economy has legs through 2020
Strong job growth and dwindling consumer debt give rise to hope.
Hotel Facilities | Jan 13, 2016
Hotel construction should remain strong through 2017
More than 100,000 rooms could be delivered this year alone.
Market Data | Jan 6, 2016
Census Bureau revises 10 years’ worth of construction spending figures
The largest revisions came in the last two years and were largely upward.
Market Data | Jan 5, 2016
Majority of AEC firms saw growth in 2015, remain optimistic for 2016: BD+C survey
By all indications, 2015 was another solid year for U.S. architecture, engineering, and construction firms.


