


In the recent U.S. Construction Pipeline Trend Report released by Lodging Econometrics (LE), at the close the fourth quarter of 2020 and after more than 6 quarters since leading all U.S. markets in the number of pipeline projects, New York City has regained top billing again with 150 projects/25,640 rooms. Other U.S. markets that follow are Los Angeles with 148 projects/24,808 rooms; Dallas with 147 projects/17,756 rooms; Atlanta with 140 projects/19,863 rooms, recording a record-high number of rooms; and Orlando with 112 projects/19,764 rooms, a record-high pipeline project count for the market.
New York City has the greatest number of projects under construction with 108 projects/19,439 rooms and also the highest number of construction starts in the fourth quarter with 14 projects/2,617 rooms. Following New York City with the highest number of projects under construction is Atlanta with 46 projects/6,728 rooms, and then Los Angeles with 40 projects/7,131 rooms; Dallas with 39 projects/4,656 rooms; and Austin with 33 projects/4,850 rooms.
Despite the impact COVID-19 has had on hotel development, there are four markets in the U.S. that announced more than 10 new construction projects in Q4 ’20. Those markets include Miami with 18 projects accounting for 2,756 rooms, Orlando with 18 projects/4,806 rooms, New York with 17 projects/2,700 rooms, and Atlanta with 11 projects/1,843 rooms.
LE has also seen an increase in announced renovation and brand conversion activity throughout the last few quarters. At year-end 2020, there were 1,308 projects/210,124 rooms in the U.S. undergoing a renovation or conversion. Of the 1,308 renovation and conversion projects, 625 of those are in the top 50 markets. There are nine markets in the U.S. that currently have more than 20 renovation and conversion projects underway. That is led by Los Angeles with 28 projects, followed by Phoenix, Washington DC, Houston, Atlanta, Dallas, Chicago, New York, and Norfolk.
The top 50 markets saw 399 hotels/52,581 rooms open in 2020. LE is forecasting these same 50 markets to open another 509 projects/66,475 rooms in 2021, and 575 projects/71,025 rooms in 2022.
Related Stories

Market Data | Jun 14, 2016
Transwestern: Market fundamentals and global stimulus driving economic growth
A new report from commercial real estate firm Transwestern indicates steady progress for the U.S. economy. Consistent job gains, wage growth, and consumer spending have offset declining corporate profits, and global stimulus plans appear to be effective.

Market Data | Jun 7, 2016
Global construction disputes took longer to resolve in 2015
The good news: the length and value of disputes in the U.S. fell last year, according to latest Arcadis report.

Market Data | Jun 3, 2016
JLL report: Retail renovation drives construction growth in 2016
Retail construction projects were up nearly 25% year-over-year, and the industrial and office construction sectors fared well, too. Economic uncertainty looms over everything, however.

Market Data | Jun 2, 2016
ABC: Nonresidential construction spending down in April
Lower building material prices, a sluggish U.S. economy, and hesitation among private developers all factor into the 2.1% drop.

Market Data | May 20, 2016
Report: Urban area population growth slows
Older Millennials are looking to buy homes and move away to more affordable suburbs and exurbs.

Market Data | May 17, 2016
Modest growth for AIA’s Architecture Billings Index in April
The American Institute of Architects reported the April ABI score was 50.6, down from the mark of 51.9 in the previous month. This score still reflects an increase in design services.

Market Data | Apr 29, 2016
ABC: Quarterly GDP growth slowest in two years
Bureau of Economic Analysis data indicates that the U.S. output is barely growing and that nonresidential investment is down.

Market Data | Apr 20, 2016
AIA: Architecture Billings Index ends first quarter on upswing
The multi-family residential sector fared the best. The Midwest was the only U.S. region that didn't see an increase in billings.
Building Technology | Apr 11, 2016
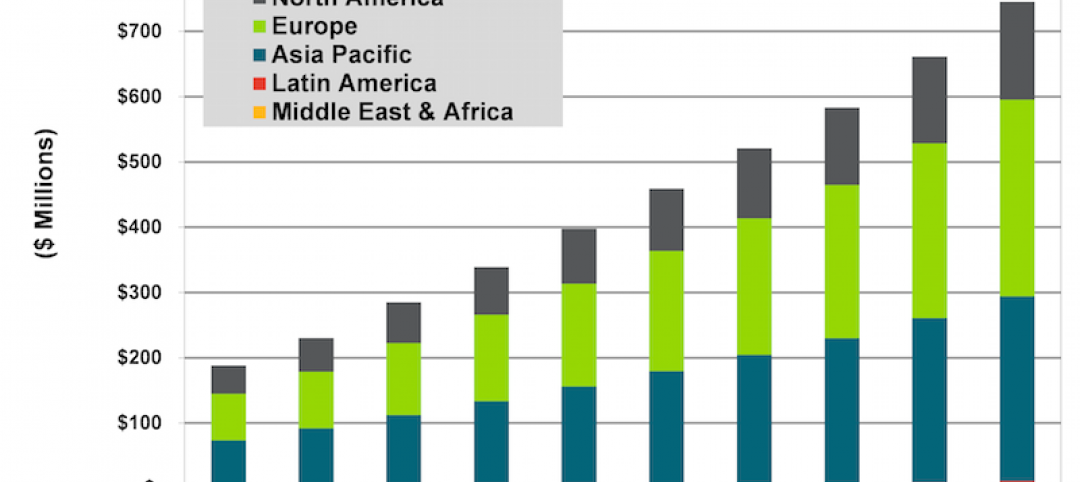
A nascent commercial wireless sensor market is poised to ascend in the next decade
Europe and Asia will propel that growth, according to a new report from Navigant.

Industry Research | Apr 7, 2016
CBRE provides latest insight into healthcare real estate investors’ strategies
Survey respondents are targeting smaller acquisitions, at a time when market cap rates are narrowing for different product types.


