


Transwestern’s latest national office report reflects resilience in market fundamentals, even in the face of the moderating pace of U.S. economic growth demonstrated by net job creation averaging 172,000 per month for the first half of the year. In this environment, the national vacancy rate held steady at 9.7% in the second quarter thanks to healthy preleasing levels of newly delivered office assets.
“Signals continue to point to a disciplined office market that will perform well through year-end,” said Elizabeth Norton, Managing Director of Research at Transwestern. “Especially noteworthy is that in the second quarter, annual asking rental rates grew 4.2% year over year, the fastest rate this cycle and well above the five-year average of 3.4%.”
At quarter end, the average asking rental rate was $26.83 per square foot. Annual rent growth has been strongest in Tampa, Florida (10.6%), followed by Nashville, Tennessee (9.5%); San Jose/Silicon Valley, California (9.4%); Austin, Texas (8.8%); and San Francisco (8.8%).
Additionally, net absorption more than doubled to 24 million square feet in the second quarter despite sublet space adding 1.9 million square feet back to available inventory. Absorption leaders during the past year include Seattle; Charlotte, North Carolina; Dallas-Fort Worth; Los Angeles; and Northern Virginia. Seattle posted nearly 6 million square feet of absorption during the past 12 months, bringing the metro’s vacancy rate down to 6.1%, the fourth-lowest of the 49 markets tracked by Transwestern.
Office construction activity hit its highest level of this cycle, growing 9.6% during the prior 12 months. The second quarter saw more than 21.7 million square feet of new space added to inventory, and this pace will continue through the remainder of the year. Currently, 163.6 million square feet is in the pipeline nationally.
Download the full Second Quarter 2019 U.S. Office Market Report at: http://twurls.com/us-office-
Related Stories

Market Data | Jan 6, 2022
A new survey offers a snapshot of New York’s construction market
Anchin’s poll of 20 AEC clients finds a “growing optimism,” but also multiple pressure points.
Market Data | Jan 3, 2022
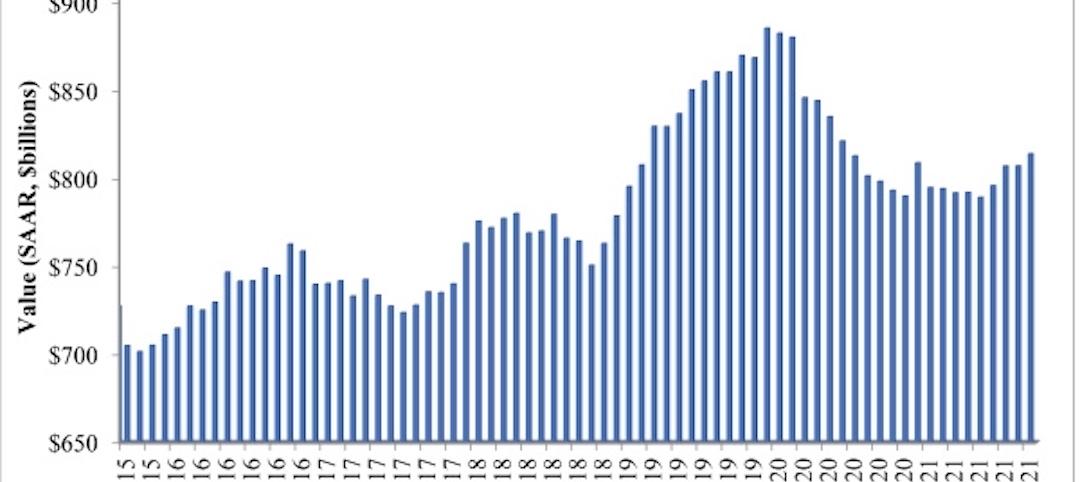
Construction spending in November increases from October and year ago
Construction spending in November totaled $1.63 trillion at a seasonally adjusted annual rate.

Market Data | Dec 22, 2021
Two out of three metro areas add construction jobs from November 2020 to November 2021
Construction employment increased in 237 or 66% of 358 metro areas over the last 12 months.
Market Data | Dec 17, 2021
Construction jobs exceed pre-pandemic level in 18 states and D.C.
Firms struggle to find qualified workers to keep up with demand.

Market Data | Dec 15, 2021
Widespread steep increases in materials costs in November outrun prices for construction projects
Construction officials say efforts to address supply chain challenges have been insufficient.

Market Data | Dec 15, 2021
Demand for design services continues to grow
Changing conditions could be on the horizon.

Market Data | Dec 5, 2021
Construction adds 31,000 jobs in November
Gains were in all segments, but the industry will need even more workers as demand accelerates.
Market Data | Dec 5, 2021
Construction spending rebounds in October
Growth in most public and private nonresidential types is offsetting the decline in residential work.
Market Data | Dec 5, 2021
Nonresidential construction spending increases nearly 1% in October
Spending was up on a monthly basis in 13 of the 16 nonresidential subcategories.
Market Data | Nov 30, 2021
Two-thirds of metro areas add construction jobs from October 2020 to October 2021
The pandemic and supply chain woes may limit gains.


