

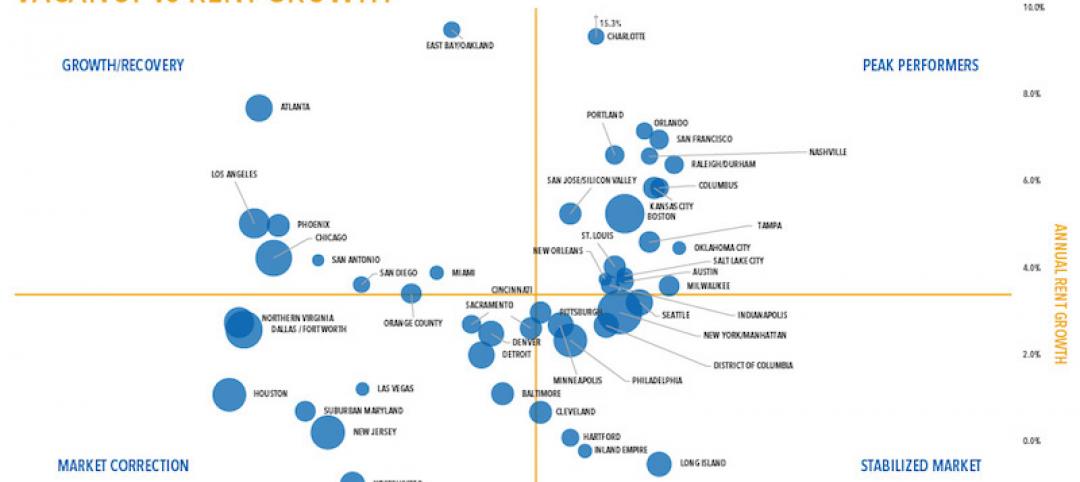
United States multifamily rents continued their impressive performance with a 3.4% year-over-year increase in July 2019, according to a new report from Yardi® Matrix.
Leading gainers included fast-growing Southwest and South metros Las Vegas, Phoenix, Charlotte and Raleigh, N.C., Atlanta and Nashville, Tenn. Rent growth was also strong in areas with concentrations of technology industries such as Boston, Seattle and Portland, Ore.
Even as multifamily fundamentals remain healthy almost everywhere, questions about the overall economy represent “potential for market volatility and slower growth,” the report says.
The average U.S. multifamily rent rose $3 in July, reaching $1,469. Sacramento, Calif., and Austin, Texas, joined Las Vegas, Phoenix and Charlotte as the month’s year-over-year growth leaders. Annual rent growth has topped 3% on a year-over-year basis for each of the past 13 months.
Read more in the Yardi Matrix multifamily national report for July 2019, which is available for download.
Yardi Matrix offers the industry’s most comprehensive market intelligence tool for investment professionals, equity investors, lenders and property managers who underwrite and manage investments in commercial real estate. Yardi Matrix covers multifamily, industrial, office and self storage property types. Email matrix@yardi.com, call 480-663-1149 or visit yardimatrix.com to learn more.
Related Stories

Market Data | May 29, 2018
America’s fastest-growing cities: San Antonio, Phoenix lead population growth
San Antonio added 24,208 people between July 2016 and July 2017, according to U.S. Census Bureau data.
Market Data | May 25, 2018
Construction group uses mobile technology to make highway work zones safer
Mobile advertising campaign urges drivers who routinely pass through certain work zones to slow down and be alert as new data shows motorists are more likely to be injured than construction workers.

Market Data | May 23, 2018
Architecture firm billings strengthen in April
Firms report solid growth for seven straight months.
Market Data | May 22, 2018
Vacancies stable, rents rising, and pipeline receding, according to Transwestern’s 1Q US Office Market report
The Big Apple still leads the new construction charge.

Market Data | May 18, 2018
Construction employment rises in 38 states and D.C. from April 2017 to April 2018
California & West Virginia have biggest annual job gains, North Dakota has largest decline; California & Louisiana have largest monthly pickup, Indiana & North Dakota lead monthly drops.

High-rise Construction | May 18, 2018
The 100 tallest buildings ever conventionally demolished
The list comes from a recent CTBUH study.

Resiliency | May 17, 2018
Architects brief lawmakers and policy-makers on disaster recovery as hurricane season approaches
Urge senate passage of disaster recovery reform act; Relationship-building with local communities.

Market Data | May 17, 2018
These 25 cities have the highest urban infill development potential
The results stem from a COMMERCIALCafé study.

Market Data | May 10, 2018
Construction costs surge in April as new tariffs and other trade measures lead to significant increases in materials prices
Association officials warn that the new tariffs and resulting price spikes have the potential to undermine benefits of tax and regulatory reform, urge administration to reconsider.

Market Data | May 7, 2018
Construction employers add 17,000 jobs in April and 257,000 for the year
Unemployment rate for construction increases slightly compared to year earlier as higher pay levels appears to be attracting people with recent construction experience back into the workforce.


