

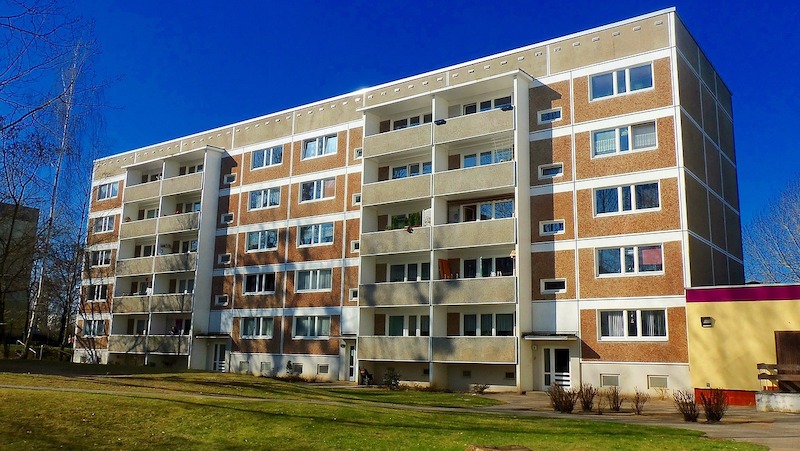
United States multifamily rents continued their impressive performance with a 3.4% year-over-year increase in July 2019, according to a new report from Yardi® Matrix.
Leading gainers included fast-growing Southwest and South metros Las Vegas, Phoenix, Charlotte and Raleigh, N.C., Atlanta and Nashville, Tenn. Rent growth was also strong in areas with concentrations of technology industries such as Boston, Seattle and Portland, Ore.
Even as multifamily fundamentals remain healthy almost everywhere, questions about the overall economy represent “potential for market volatility and slower growth,” the report says.
The average U.S. multifamily rent rose $3 in July, reaching $1,469. Sacramento, Calif., and Austin, Texas, joined Las Vegas, Phoenix and Charlotte as the month’s year-over-year growth leaders. Annual rent growth has topped 3% on a year-over-year basis for each of the past 13 months.
Read more in the Yardi Matrix multifamily national report for July 2019, which is available for download.
Yardi Matrix offers the industry’s most comprehensive market intelligence tool for investment professionals, equity investors, lenders and property managers who underwrite and manage investments in commercial real estate. Yardi Matrix covers multifamily, industrial, office and self storage property types. Email matrix@yardi.com, call 480-663-1149 or visit yardimatrix.com to learn more.
Related Stories
Market Data | Apr 29, 2019
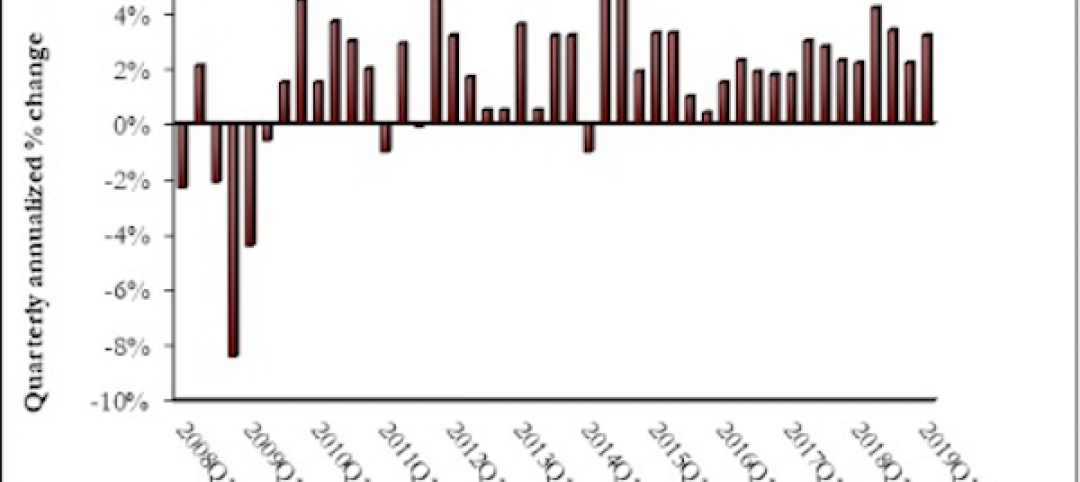
U.S. economic growth crosses 3% threshold to begin the year
Growth was fueled by myriad factors, including personal consumption expenditures, private inventory investment, surprisingly rapid growth in exports, state and local government spending and intellectual property.

Market Data | Apr 18, 2019
ABC report: 'Confidence seems to be making a comeback in America'
The Construction Confidence Index remained strong in February, according to the Associated Builders and Contractors.

Market Data | Apr 16, 2019
ABC’s Construction Backlog Indicator rebounds in February
ABC's Construction Backlog Indicator expanded to 8.8 months in February 2019.

Market Data | Apr 8, 2019
Engineering, construction spending to rise 3% in 2019: FMI outlook
Top-performing segments forecast in 2019 include transportation, public safety, and education.

Market Data | Apr 1, 2019
Nonresidential spending expands again in February
Private nonresidential spending fell 0.5% for the month and is only up 0.1% on a year-over-year basis.

Market Data | Mar 22, 2019
Construction contractors regain confidence in January 2019
Expectations for sales during the coming six-month period remained especially upbeat in January.

Market Data | Mar 21, 2019
Billings moderate in February following robust New Year
AIA’s Architecture Billings Index (ABI) score for February was 50.3, down from 55.3 in January.

Market Data | Mar 19, 2019
ABC’s Construction Backlog Indicator declines sharply in January 2019
The Construction Backlog Indicator contracted to 8.1 months during January 2019.

Market Data | Mar 15, 2019
2019 starts off with expansion in nonresidential spending
At a seasonally adjusted annualized rate, nonresidential spending totaled $762.5 billion for the month.

Market Data | Mar 14, 2019
Construction input prices rise for first time since October
Of the 11 construction subcategories, seven experienced price declines for the month.


