


The brief downturn in the Multifamily-for-Rent market outlook is clearly over as PSMJ’s forward-looking proposal activity metric reached its highest level for the sector in nearly two years. Proposal activity in the 4th Quarter, as measured by PSMJ’s Net Plus/Minus Index, climbed to 58% in the 4th Quarter, up from 40% in the 3rd Quarter. This is the sector’s highest NPMI since it hit 76% in the 1st Quarter of 2018, according to PSMJ Resources’ Quarterly Market Forecast (QMF). Multifamily had plummeted to -2% and +7%, respectively, in the first two quarters of 2020, coming off a 4th Quarter 2019 NPMI of 54%. Its 1st Quarter 2020 performance was its lowest in almost a decade.
PSMJ Senior Principal David Burstein, PE, AECPM, noted that the turnaround in the Multifamily-for-Rent and Condominium markets are part of an overall upward trend for all Housing markets. “The significant turnaround in both of these multifamily markets are attributable to an increase in personal savings resulting from the government’s stimulus checks as well as significant movement of many people from cities to suburbs – which is shifting the location of the demand,” he said. “So we believe the Multifamily market will continue to be strong into the foreseeable future.”
PSMJ’s NPMI expresses the difference between the percentage of firms reporting an increase in proposal activity and those reporting a decrease. The QMF has proven to be a solid predictor of market health for the architecture and engineering (A/E) industry since its inception in 2003. A consistent group of over 300 A/E firm leaders participate regularly, with 132 contributing to the most recent survey.

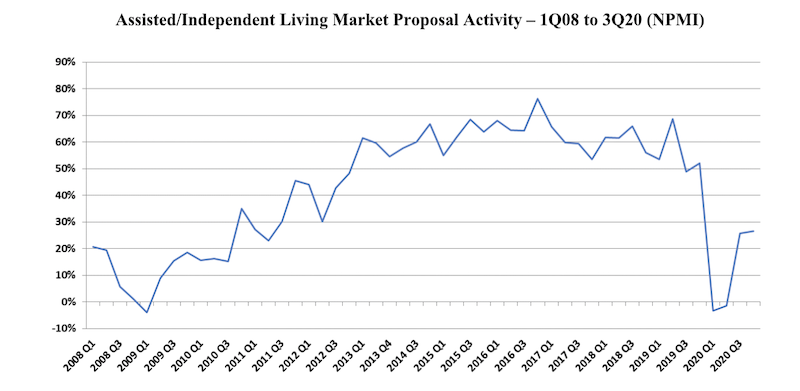
The Condominium and Assisted/Independent Living markets also continued their rebound. Condos’ NPMI crept up to 15% from 11% in the 3rd Quarter, off dismal results in the 1st (-28%) and 2nd (-26%) quarters. The 4th Quarter performance for Condos was still off from the 22% it recorded in the 4th Quarter of 2019. Similarly, Assisted/Independent Living showed minor improvement in the 4th Quarter (up from 26% to 27%, quarter over quarter) and down from the 52% the survey reported for the sector a year ago. It was also negative in the 1st (-3%) and 2nd (-1%) quarters of 2020.
The two other Housing markets measured in the PSMJ survey also show long-term promise for design and construction activity, according to the QMF. Single-Family Homes (59%) and Single-Family Subdivisions (51%) both reached their highest NPMI since PSMJ began collecting survey data for submarkets in 2006.
Among the 12 major markets surveyed, Energy/Utilities unseated Housing with an NPMI of 47%, though Housing’s runner-up NPMI of 43% was an improvement from 38% in the 3rd Quarter. Water/Wastewater, another stand-out during COVID, slipped to 6th among the 12 markets measured. Its NPMI of 23% is down from 37% the prior quarter. Healthcare’s outlook remained steady at 35% (up from 30%), as did Light Industry (35%, up from 27%). Heavy Industry had the greatest gain, rocketing to 32% from 0% due to strong scores in Product Manufacturing (40%) and Pharmaceutical Production (35%).
Proposal activity for Education projects trailed again at -29%, though it improved from -37%. Commercial Users (-29%, up from -31%) and Commercial Developers (-13% up from -23%) rounded out the dozen.
PSMJ Resources, a consulting and publishing company dedicated to the A/E industry, has conducted its Quarterly Market Forecast for more than 17 years. It includes data on 12 major markets and 58 submarkets served by A/E firms. For more information, go to https://www.psmj.com/surveys/quarterly-market-forecast-2.
Related Stories

Market Data | Mar 8, 2018
Prioritizing your marketing initiatives
It’s time to take a comprehensive look at your plans and figure out the best way to get from Point A to Point B.

Market Data | Mar 6, 2018
Persistent workforce shortages challenge commercial construction industry as U.S. building demands continue to grow
To increase jobsite efficiency and improve labor productivity, increasingly more builders are turning to alternative construction solutions.
Market Data | Mar 2, 2018
Nonresidential construction spending dips slightly in January
Private nonresidential construction fell 1.5% for the month, while public sector nonresidential spending increased 1.9%.

Market Data | Feb 27, 2018
AIA small firm report: Half of employees have ownership stake in their firm
The American Institute of Architects has released its first-ever Small Firm Compensation Report.

Market Data | Feb 21, 2018
Strong start for architecture billings in 2018
The American Institute of Architects reported the January 2018 ABI score was 54.7, up from a score of 52.8 in the previous month.
Multifamily Housing | Feb 15, 2018
United States ranks fourth for renter growth
Renters are on the rise in 21 of the 30 countries examined in RentCafé’s recent study.

Market Data | Feb 1, 2018
Nonresidential construction spending expanded 0.8% in December, brighter days ahead
“The tax cut will further bolster liquidity and confidence, which will ultimately translate into more construction starts and spending,” said ABC Chief Economist Anirban Basu.

Green | Jan 31, 2018
U.S. Green Building Council releases annual top 10 states for LEED green building per capita
Massachusetts tops the list for the second year; New York, Hawaii and Illinois showcase leadership in geographically diverse locations.

Industry Research | Jan 30, 2018
AIA’s Kermit Baker: Five signs of an impending upturn in construction spending
Tax reform implications and rebuilding from natural disasters are among the reasons AIA’s Chief Economist is optimistic for 2018 and 2019.

Market Data | Jan 30, 2018
AIA Consensus Forecast: 4.0% growth for nonresidential construction spending in 2018
The commercial office and retail sectors will lead the way in 2018, with a strong bounce back for education and healthcare.


