

The brief downturn in the Multifamily-for-Rent market outlook is clearly over as PSMJ’s forward-looking proposal activity metric reached its highest level for the sector in nearly two years. Proposal activity in the 4th Quarter, as measured by PSMJ’s Net Plus/Minus Index, climbed to 58% in the 4th Quarter, up from 40% in the 3rd Quarter. This is the sector’s highest NPMI since it hit 76% in the 1st Quarter of 2018, according to PSMJ Resources’ Quarterly Market Forecast (QMF). Multifamily had plummeted to -2% and +7%, respectively, in the first two quarters of 2020, coming off a 4th Quarter 2019 NPMI of 54%. Its 1st Quarter 2020 performance was its lowest in almost a decade.
PSMJ Senior Principal David Burstein, PE, AECPM, noted that the turnaround in the Multifamily-for-Rent and Condominium markets are part of an overall upward trend for all Housing markets. “The significant turnaround in both of these multifamily markets are attributable to an increase in personal savings resulting from the government’s stimulus checks as well as significant movement of many people from cities to suburbs – which is shifting the location of the demand,” he said. “So we believe the Multifamily market will continue to be strong into the foreseeable future.”
PSMJ’s NPMI expresses the difference between the percentage of firms reporting an increase in proposal activity and those reporting a decrease. The QMF has proven to be a solid predictor of market health for the architecture and engineering (A/E) industry since its inception in 2003. A consistent group of over 300 A/E firm leaders participate regularly, with 132 contributing to the most recent survey.

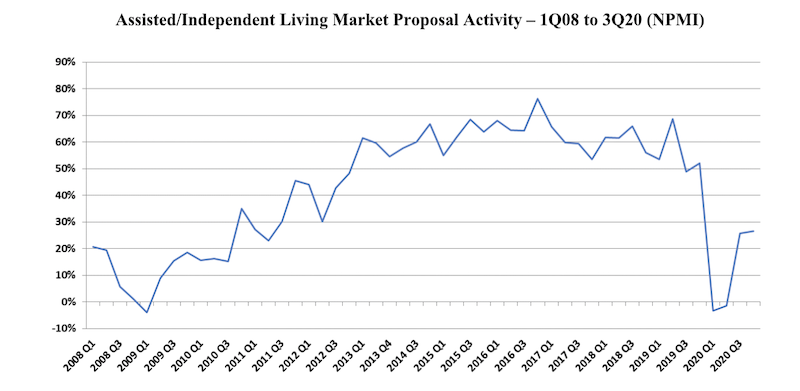
The Condominium and Assisted/Independent Living markets also continued their rebound. Condos’ NPMI crept up to 15% from 11% in the 3rd Quarter, off dismal results in the 1st (-28%) and 2nd (-26%) quarters. The 4th Quarter performance for Condos was still off from the 22% it recorded in the 4th Quarter of 2019. Similarly, Assisted/Independent Living showed minor improvement in the 4th Quarter (up from 26% to 27%, quarter over quarter) and down from the 52% the survey reported for the sector a year ago. It was also negative in the 1st (-3%) and 2nd (-1%) quarters of 2020.
The two other Housing markets measured in the PSMJ survey also show long-term promise for design and construction activity, according to the QMF. Single-Family Homes (59%) and Single-Family Subdivisions (51%) both reached their highest NPMI since PSMJ began collecting survey data for submarkets in 2006.
Among the 12 major markets surveyed, Energy/Utilities unseated Housing with an NPMI of 47%, though Housing’s runner-up NPMI of 43% was an improvement from 38% in the 3rd Quarter. Water/Wastewater, another stand-out during COVID, slipped to 6th among the 12 markets measured. Its NPMI of 23% is down from 37% the prior quarter. Healthcare’s outlook remained steady at 35% (up from 30%), as did Light Industry (35%, up from 27%). Heavy Industry had the greatest gain, rocketing to 32% from 0% due to strong scores in Product Manufacturing (40%) and Pharmaceutical Production (35%).
Proposal activity for Education projects trailed again at -29%, though it improved from -37%. Commercial Users (-29%, up from -31%) and Commercial Developers (-13% up from -23%) rounded out the dozen.
PSMJ Resources, a consulting and publishing company dedicated to the A/E industry, has conducted its Quarterly Market Forecast for more than 17 years. It includes data on 12 major markets and 58 submarkets served by A/E firms. For more information, go to https://www.psmj.com/surveys/quarterly-market-forecast-2.
Related Stories

Hotel Facilities | Apr 24, 2024
The U.S. hotel construction market sees record highs in the first quarter of 2024
As seen in the Q1 2024 U.S. Hotel Construction Pipeline Trend Report from Lodging Econometrics (LE), at the end of the first quarter, there are 6,065 projects with 702,990 rooms in the pipeline. This new all-time high represents a 9% year-over-year (YOY) increase in projects and a 7% YOY increase in rooms compared to last year.

Construction Costs | Apr 18, 2024
New download: BD+C's April 2024 Market Intelligence Report
Building Design+Construction's monthly Market Intelligence Report offers a snapshot of the health of the U.S. building construction industry, including the commercial, multifamily, institutional, and industrial building sectors. This report tracks the latest metrics related to construction spending, demand for design services, contractor backlogs, and material price trends.

Market Data | Apr 16, 2024
The average U.S. contractor has 8.2 months worth of construction work in the pipeline, as of March 2024
Associated Builders and Contractors reported today that its Construction Backlog Indicator increased to 8.2 months in March from 8.1 months in February, according to an ABC member survey conducted March 20 to April 3. The reading is down 0.5 months from March 2023.

K-12 Schools | Apr 10, 2024
Surprise, surprise: Students excel in modernized K-12 school buildings
Too many of the nation’s school districts are having to make it work with less-than-ideal educational facilities. But at what cost to student performance and staff satisfaction?

Multifamily Housing | Apr 9, 2024
March reports record gains in multifamily rent growth in 20 months
Asking rents for multifamily units increased $8 during the month to $1,721; year-over-year growth grew 30 basis points to 0.9 percent—a normal seasonal growth pattern according to Yardi Matrix.

Retail Centers | Apr 4, 2024
Retail design trends: Consumers are looking for wellness in where they shop
Consumers are making lifestyle choices with wellness in mind, which ignites in them a feeling of purpose and a sense of motivation. That’s the conclusion that the architecture and design firm MG2 draws from a survey of 1,182 U.S. adult consumers the firm conducted last December about retail design and what consumers want in healthier shopping experiences.

Market Data | Apr 1, 2024
Nonresidential construction spending dips 1.0% in February, reaches $1.179 trillion
National nonresidential construction spending declined 1.0% in February, according to an Associated Builders and Contractors analysis of data published today by the U.S. Census Bureau. On a seasonally adjusted annualized basis, nonresidential spending totaled $1.179 trillion.

Market Data | Mar 26, 2024
Architecture firm billings see modest easing in February
Architecture firm billings continued to decline in February, with an AIA/Deltek Architecture Billings Index (ABI) score of 49.5 for the month. However, February’s score marks the most modest easing in billings since July 2023 and suggests that the recent slowdown may be receding.

K-12 Schools | Mar 18, 2024
New study shows connections between K-12 school modernizations, improved test scores, graduation rates
Conducted by Drexel University in conjunction with Perkins Eastman, the research study reveals K-12 school modernizations significantly impact key educational indicators, including test scores, graduation rates, and enrollment over time.

MFPRO+ News | Mar 16, 2024
Multifamily rents stable heading into spring 2024
National asking multifamily rents posted their first increase in over seven months in February. The average U.S. asking rent rose $1 to $1,713 in February 2024, up 0.6% year-over-year.


