

Top Local Government Sector Architecture Firms
| Rank | Company | 2012 Local Government Revenue ($) |
| 1 | Stantec | $71,896,892 |
| 2 | HOK | $49,140,000 |
| 3 | IBI Group | $37,523,493 |
| 4 | Heery International | $23,648,201 |
| 5 | PGAL | $19,500,000 |
| 6 | Perkins+Will | $12,997,959 |
| 7 | EYP | $11,000,000 |
| 8 | Skidmore, Owings & Merrill | $10,903,000 |
| 9 | Reynolds, Smith and Hills | $10,900,000 |
| 10 | ZGF Architects | $10,014,686 |
| 11 | Leo A Daly | $9,843,419 |
| 12 | HDR Architecture | $9,088,649 |
| 13 | Kaplan McLaughlin Diaz | $8,401,994 |
| 14 | Fentress Architects | $7,864,890 |
| 15 | SmithGroupJJR | $7,200,000 |
| 16 | HMC Architects | $6,473,080 |
| 17 | HNTB Archtecture | $5,733,633 |
| 18 | Sasaki Associates | $5,532,630 |
| 19 | Epstein | $5,089,000 |
| 20 | Wight & Co. | $4,710,300 |
| 21 | Moseley Architects | $4,431,529 |
| 22 | Albert Kahn Family of Companies | $4,411,177 |
| 23 | Beyer Blinder Belle Architects & Planners | $4,215,038 |
| 24 | LMN Architects | $4,125,500 |
| 25 | HKS | $3,600,000 |
| 26 | Goodwyn, Mills & Cawood | $3,560,000 |
| 27 | BBS Architects, Landscape Architects and Engineers | $3,100,000 |
| 28 | Swanke Hayden Connell Asrchitects | $3,000,000 |
| 29 | Ennead Architects | $2,890,000 |
| 30 | FGM Architects | $2,722,245 |
| 31 | Little | $2,529,000 |
| 32 | Morris Architects | $2,300,000 |
| 33 | Fletcher-Thompson | $2,275,000 |
| 34 | CTA Architects Engineers | $1,610,105 |
| 35 | LPA | $1,582,631 |
| 36 | Solomon Cordwell Buenz | $1,500,000 |
| 36 | Westlake Reed Leskosky | $1,500,000 |
| 38 | NBBJ | $1,439,000 |
| 39 | Harley Ellis Devereaux | $1,323,000 |
| 40 | RNL | $832,000 |
| 41 | Kirksey Architecture | $784,592 |
| 42 | CO Architects | $772,000 |
| 43 | Good Fulton & Farrell | $761,297 |
| 44 | TEG Architects - The Estopinal Group | $754,228 |
| 45 | H3 Hardy Collaboration Architecture | $750,000 |
| 46 | KZF Design | $736,905 |
| 47 | Nadel | $679,134 |
| 48 | Hoefer Wysocki Architecture | $639,000 |
| 49 | RTKL Associates | $626,000 |
| 50 | Gresham, Smith and Partners | $625,969 |
| 51 | Ware Malcomb | $608,000 |
| 52 | PageSoutherlandPage | $564,550 |
| 53 | Shepley Bulfinch Richardson & Abbott | $522,550 |
| 54 | GBBN Architects | $500,000 |
| 55 | LS3P | $487,648 |
| 56 | Perkins Eastman | $475,000 |
| 57 | Ashley McGraw Architects | $457,881 |
| 58 | Emersion Design | $435,679 |
| 59 | Smallwood, Reynolds, Stewart, Stewart & Associates | $427,939 |
| 60 | OZ Architecture | $414,466 |
| 61 | DLA Architects | $408,180 |
| 62 | Carrier Johnson + Culture | $387,386 |
| 63 | Legat Architects | $348,000 |
| 64 | Hnedak Bobo Group | $335,000 |
| 65 | VOA Associates | $324,770 |
| 66 | RSP Architects | $301,000 |
| 67 | WDG Architecture | $215,000 |
| 68 | Astorino | $209,000 |
| 69 | Environetics | $199,427 |
| 70 | FXFOWLE Architects | $184,551 |
| 71 | Niles Bolton Associates | $165,693 |
| 72 | Cambridge Seven Associates | $150,000 |
| 73 | Cooper Carry | $148,453 |
| 74 | Hoffmann Architects | $100,000 |
| 75 | Francis Cauffman | $59,377 |
| 76 | JRS Architect | $50,000 |
| 77 | DesignGroup | $18,330 |
Top Local Government Sector Engineering Firms
| Rank | Company | 2012 Local Government Revenue ($) |
| 1 | STV | $170,285,000 |
| 2 | URS Corp. | $58,897,110 |
| 3 | AECOM Technology Corp. | $50,000,000 |
| 4 | Arup | $18,981,280 |
| 5 | Smith Seckman Reid | $16,715,381 |
| 6 | Science Applications International Corp. | $15,801,804 |
| 7 | Dewberry | $9,114,869 |
| 8 | Simpson Gumpertz & Heger | $8,400,000 |
| 9 | Syska Hennessy Group | $8,141,149 |
| 10 | Walker Parking Consultants | $7,700,000 |
| 11 | Michael Baker Jr. | $6,400,000 |
| 12 | Walter P Moore | $5,367,002 |
| 13 | Clark Nexsen | $5,085,734 |
| 14 | Shive-Hattery | $4,891,919 |
| 15 | Aon Fire Protection Engineering | $3,000,000 |
| 15 | French & Parrello Associates | $3,000,000 |
| 17 | Glumac | $2,790,000 |
| 18 | M/E Engineering | $2,268,700 |
| 19 | GRAEF | $2,259,738 |
| 20 | Sparling | $2,191,493 |
| 21 | Coffman Engineers | $2,176,000 |
| 22 | TLC Engineering for Architecture | $1,985,092 |
| 23 | KJWW Engineering Consultants | $1,943,760 |
| 24 | Ross & Baruzzini | $1,881,254 |
| 25 | Thornton Tomasetti | $1,805,320 |
| 26 | Burns & McDonnell | $1,500,000 |
| 27 | Affiliated Engineers | $1,493,000 |
| 28 | WSP USA | $1,475,000 |
| 29 | Interface Engineering | $1,467,579 |
| 30 | TTG | $1,250,700 |
| 31 | Newcomb & Boyd | $1,159,914 |
| 32 | RDK Engineers | $1,147,000 |
| 33 | KPFF Consulting Engineers | $1,000,000 |
| 33 | Merrick & Co. | $1,000,000 |
| 33 | Rolf Jensen & Associates | $1,000,000 |
| 36 | Henderson Engineers | $938,172 |
| 37 | Barge, Waggoner, Sumner and Cannon | $900,000 |
| 38 | Heapy Engineering | $766,568 |
| 39 | Primera Engineers | $763,000 |
| 40 | Degenkolb Engineers | $709,034 |
| 41 | Wiss, Janney, Elstner Associates | $700,000 |
| 42 | Environmental Systems Design | $635,100 |
| 43 | ThermalTech Engineering | $625,000 |
| 44 | M-E Engineers | $600,000 |
| 45 | GHT Limited | $550,000 |
| 46 | Bridgers & Paxton Consulting Engineers | $540,170 |
| 47 | KCI Technologies | $500,000 |
| 47 | Paulus, Sokolowski and Sartor | $500,000 |
| 49 | AKF Group | $483,020 |
| 50 | Zak Companies | $443,642 |
| 51 | GRW | $422,280 |
| 52 | Buro Happold Consulting Engineers | $410,000 |
| 53 | Davis, Bowen & Friedel | $402,776 |
| 54 | Vanderweil Engineers | $399,400 |
| 55 | Bergmann Associates | $399,000 |
| 56 | Guernsey | $383,954 |
| 57 | Brinjac Engineering | $364,145 |
| 58 | Eaton Energy Solutions | $356,516 |
| 59 | H&A Architects & Engineers | $320,929 |
| 60 | CTLGroup | $300,000 |
| 61 | Dunham Associates | $290,000 |
| 62 | Apogee Consulting Group | $284,000 |
| 63 | Allen & Shariff | $240,000 |
| 64 | CJL Engineering | $215,000 |
| 65 | KLH Engineers | $200,905 |
| 66 | OLA Consulting Engineers | $200,000 |
| 67 | Haynes Whaley Associates | $163,550 |
| 68 | Wallace Engineering | $150,000 |
| 69 | Spectrum Engineers | $144,338 |
| 70 | Wick Fisher White | $137,400 |
| 71 | H.F. Lenz | $100,000 |
| 71 | Peter Basso Associates | $100,000 |
| 73 | G&W Engineering | $80,000 |
| 74 | P2S Engineering | $59,268 |
| 75 | FBA Engineering | $50,000 |
| 75 | Rist-Frost-Shumway Engineering | $50,000 |
| 77 | Total Building Commissioning | $38,192 |
| 78 | Kamm Consulting | $27,425 |
| 79 | SSOE Group | $17,850 |
Top Local Government Sector Construction Firms
| Rank | Company | 2012 Local Government Revenue ($) |
| 1 | Turner Corporation, The | $1,226,581,000 |
| 2 | Clark Group | $548,902,070 |
| 3 | PCL Construction Enterprises | $517,584,491 |
| 4 | Walsh Group, The | $450,441,105 |
| 5 | Manhattan Construction | $243,963,000 |
| 6 | Hunt Construction Group | $196,000,000 |
| 7 | Gilbane | $191,794,000 |
| 8 | McCarthy Holdings | $176,000,000 |
| 9 | Balfour Beatty | $171,637,641 |
| 10 | Skanska USA | $157,244,000 |
| 11 | Flintco | $136,000,000 |
| 12 | Tutor Perini Corporation | $133,802,102 |
| 13 | Hensel Phelps | $115,779,020 |
| 14 | Coakley & Williams Construction | $92,161,782 |
| 15 | Whiting-Turner Contracting Co., The | $91,018,874 |
| 16 | Shawmut Design and Construction | $90,000,000 |
| 17 | C.W. Driver | $82,690,564 |
| 18 | Jones Lang LaSalle | $71,807,280 |
| 19 | Messer Construction | $70,425,218 |
| 20 | O'Neil Industries/W.E. O'Neil | $66,772,883 |
| 21 | Sundt Construction | $60,800,674 |
| 22 | JE Dunn Construction | $49,135,681 |
| 23 | Holder Construction | $47,000,000 |
| 24 | Suffolk Construction | $42,967,386 |
| 25 | CORE Construction Group | $40,823,749 |
| 26 | Swinerton Builders | $38,127,950 |
| 27 | Clancy & Theys Construction | $36,766,000 |
| 28 | Layton Construction | $35,000,000 |
| 29 | Mortenson Construction | $34,582,000 |
| 30 | Walbridge | $34,000,000 |
| 31 | W. M. Jordan Co. | $32,836,071 |
| 32 | Lend Lease | $26,345,000 |
| 33 | Brasfield & Gorrie | $21,905,473 |
| 34 | Paric | $20,000,000 |
| 35 | Ryan Companies US | $18,608,330 |
| 36 | Stalco Construction | $16,800,000 |
| 37 | James McHugh Construction | $16,433,441 |
| 38 | HITT Contracting | $16,032,387 |
| 39 | Bomel Construction | $16,000,000 |
| 40 | EMJ | $15,000,000 |
| 41 | Bernards | $14,000,000 |
| 42 | Weitz Co., The | $13,000,000 |
| 43 | Choate Construction | $12,058,849 |
| 44 | Linbeck Group | $11,000,000 |
| 45 | Hill & Wilkinson General Contractors | $9,087,195 |
| 46 | IMC Construction | $8,996,480 |
| 47 | E.W. Howell | $7,924,000 |
| 48 | Yates Cos., The | $7,400,000 |
| 49 | Batson-Cook | $7,287,137 |
| 50 | Kraus-Anderson Construction | $7,000,000 |
| 51 | Structure Tone | $4,512,000 |
| 52 | Kitchell | $3,950,000 |
| 53 | S. M. Wilson & Co. | $3,052,915 |
| 54 | LPCiminelli | $2,702,059 |
| 55 | DPR Construction | $2,224,982 |
| 56 | Bette Companies, The | $2,000,000 |
| 57 | Hoar Construction | $1,173,000 |
| 58 | Hunt Companies | $920,149 |
| 59 | Hoffman Construction | $785,912 |
| 60 | New South Construction | $230,000 |
| 61 | Boldt Company, The | $153,885 |
| 62 | Power Construction | $100,000 |
| 63 | Graycor | $72,800 |
Back to Government Giants article
Read the full 2013 Giants 300 Report
Related Stories

Digital Twin | May 24, 2021
Digital twin’s value propositions for the built environment, explained
Ernst & Young’s white paper makes its cases for the technology’s myriad benefits.

Multifamily Housing | Mar 28, 2021
Smart home technology 101 for multifamily housing communities
Bulk-services Wi-Fi leads to better connectivity, products, and services to help multifamily developers create greater value for residents–and their own bottom line.

Market Data | Feb 24, 2021
2021 won’t be a growth year for construction spending, says latest JLL forecast
Predicts second-half improvement toward normalization next year.

Airports | Jan 26, 2021
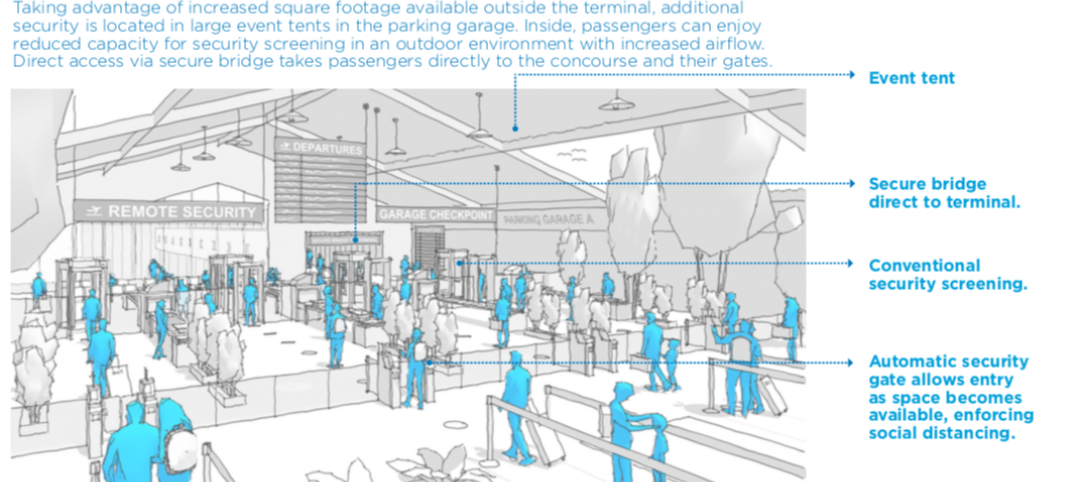
Security concerns will drive demand for airport technology over the next five years
A new report explores where and what spending for “smart” airports is likely to focus on.

Giants 400 | Dec 16, 2020
Download a PDF of all 2020 Giants 400 Rankings
This 70-page PDF features AEC firm rankings across 51 building sectors, disciplines, and specialty services.

Giants 400 | Dec 2, 2020
2020 Airport Sector Giants: Top architecture, engineering, and construction firms in the U.S. airport facilities sector
AECOM, Hensel Phelps, and PGAL top BD+C's rankings of the nation's largest airport sector architecture, engineering, and construction firms, as reported in the 2020 Giants 400 Report.
Airports | Nov 20, 2020
Populous survey shows travelers are ready to return to the airport, with proper protection
Survey data points to achievable solutions for airports around the globe.

AEC Tech | Nov 12, 2020
The Weekly show: Nvidia's Omniverse, AI for construction scheduling, COVID-19 signage
BD+C editors speak with experts from ALICE Technologies, Build Group, Hastings Architecture, Nvidia, and Woods Bagot on the November 12 episode of "The Weekly." The episode is available for viewing on demand.

Airports | Oct 6, 2020
Airport of the Future global student design competition 2020 winners announced
Winning projects reimagine airport mobility in the year 2100 for one of the 20 busiest airports in the world.

Airports | Sep 18, 2020
Infection control measures for airport terminals
More automation and scanning, of people and baggage, will help unclog airports.


