

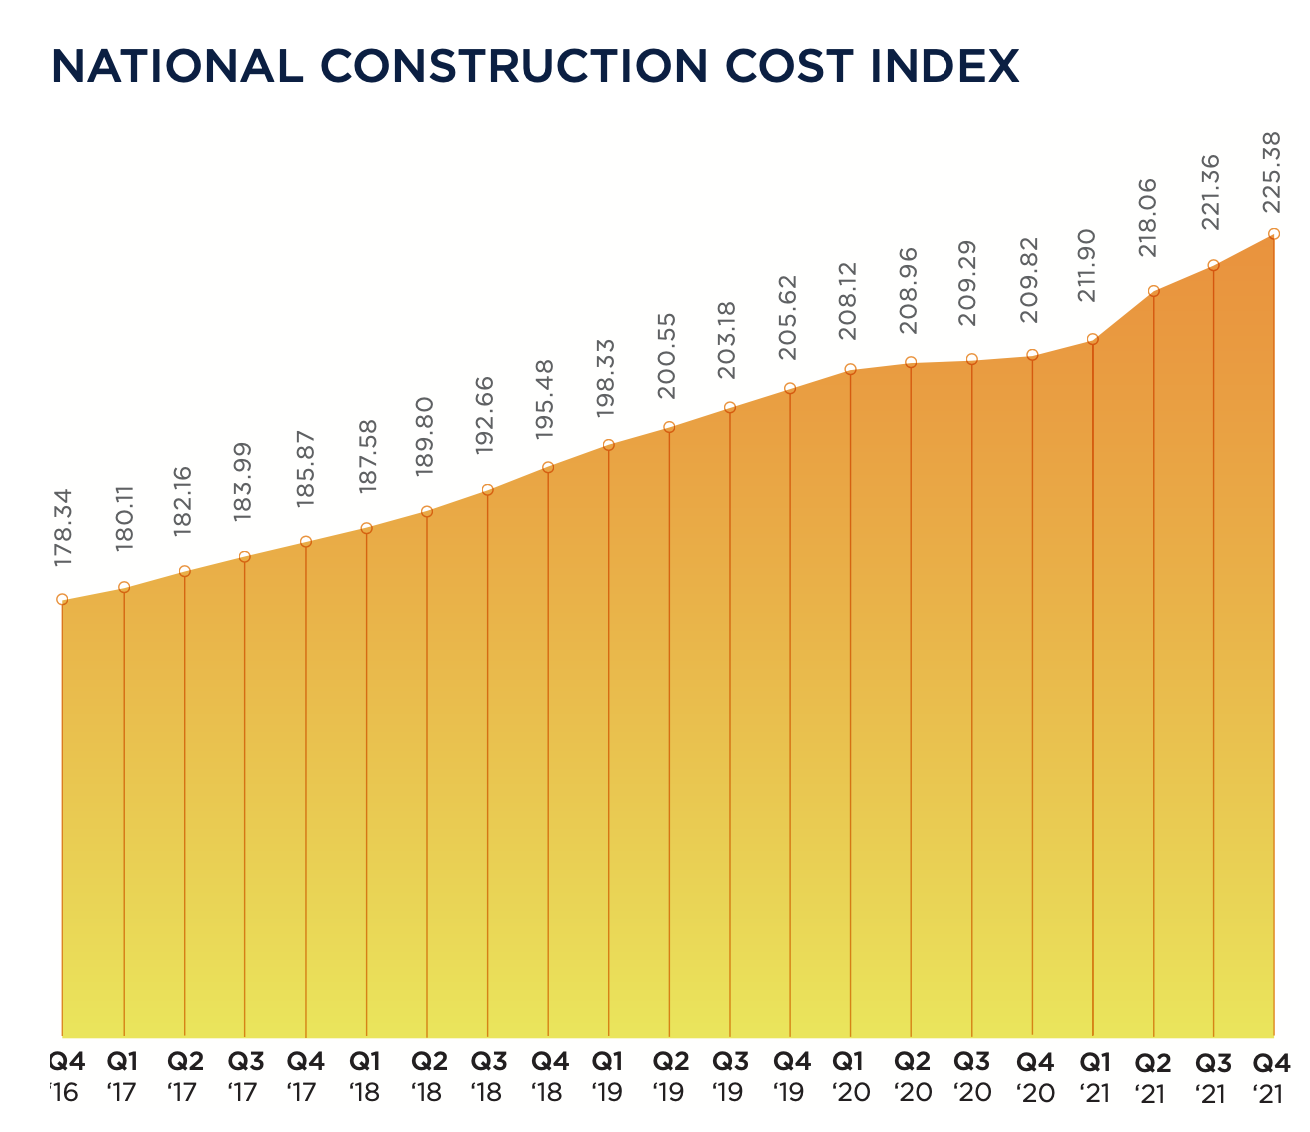
In the 12 months ended December 2021, bid construction costs rose 7.42 percent. “These increases are reminiscent of the sort of cost increases that we saw in the period 2004 to 2007,” wrote Julian Anderson, FRICS, President-North America for the construction advisory firm Rider Levett Bucknall (RLB), which today released its Fourth Quarter 2021 North America Construction Cost Report.
RLB’s National Construction Cost Index for the fourth quarter stood at 225.38, 7.4 percent higher than the Index for the fourth quarter of 2020, and 1.8 percent higher than last year’s third quarter. In his essay for this report, Anderson was optimistic about the eventual positive impact of the recently passed Bipartisan Infrastructure bill on construction and repair.
However, the force of that legislation could be stymied, or at least delayed, by supply chain problems that continue to plague the industry. Bottlenecks at western ports and chronic shortages of skilled labor still contribute to this volatility. Cost increases are also a function of rising inflation, as the Consumer Price Index registered a year-over-year increase of 5.38 percent.
On the positive side, America’s Gross Domestic Product, which measures output, returned to 2.1 percent, which was about where it was in the pre-pandemic fourth quarter of 2019. And the rate of unemployment for the construction sector dipped to 4.5 percent in Q421, versus 9.6 percent in Q420. Construction tracked national unemployment that has also been on a downward trend.
SEVERAL METROS BUCKED QUARTERLY COST TREND
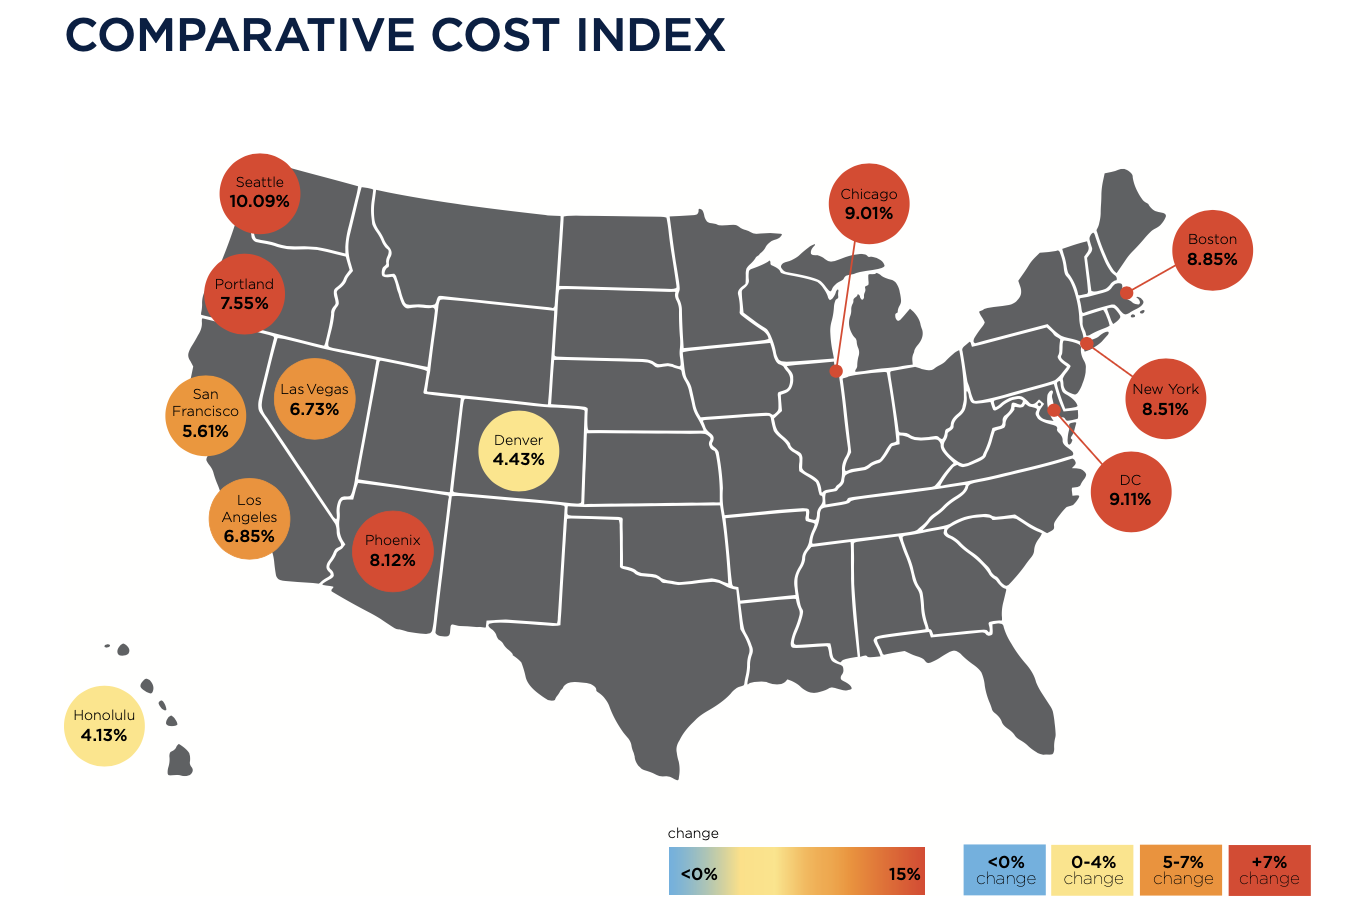
Nonresidential construction spending in November 2021, the latest month for which data were available from the Census Bureau, stood at $820.6 billion, 3.4 percent higher than the same month in 2021. But materials and labor keep getting more expensive, too. RLB’s Comparative Cost Index found that, from October 2020 through October 2021, construction costs rose by 10.09 percent in Seattle, by 9.11 percent in Washington DC, by 9.01 percent in Chicago, by 8.85 percent in Boston, and by 8.51 percent in New York.
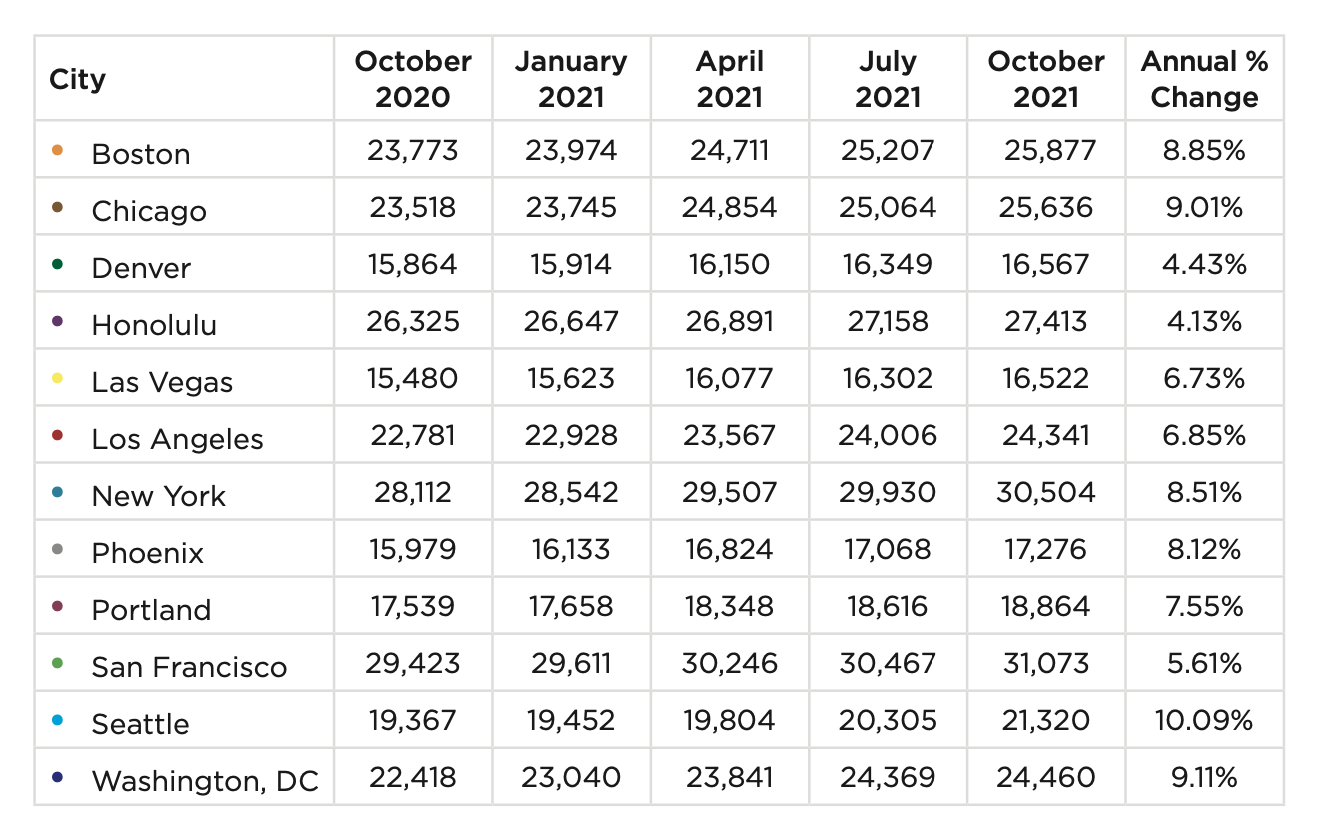
Indexed by building type, construction costs were among the highest in New York for offices, shopping malls, hospitals, single-family homes, and high schools. San Francisco’s construction costs exceeded the other markets RLB tracked for five-star hotels, hospitals, warehouses, parking structures, multifamily homes, high schools, and universities.
Honolulu is the most expensive market in which to build elementary schools. But that market, along with Denver, Las Vegas, Los Angeles, Phoenix, Portland, and Washington DC, experienced overall cost increases between July 1 and October 1 that were less than the national average for that period, according to RLB estimates.
Related Stories

Contractors | Jun 13, 2023
The average U.S. contractor has 8.9 months worth of construction work in the pipeline, as of May 2023
Associated Builders and Contractors reported that its Construction Backlog Indicator remained unchanged at 8.9 months in May, according to an ABC member survey conducted May 20 to June 7. The reading is 0.1 months lower than in May 2022. Backlog in the infrastructure category ticked up again and has now returned to May 2022 levels. On a regional basis, backlog increased in every region but the Northeast.

Industry Research | Jun 13, 2023
Two new surveys track how the construction industry, in the U.S. and globally, is navigating market disruption and volatility
The surveys, conducted by XYZ Reality and KPMG International, found greater willingness to embrace technology, workplace diversity, and ESG precepts.
| Jun 5, 2023
Communication is the key to AEC firms’ mental health programs and training
The core of recent awareness efforts—and their greatest challenge—is getting workers to come forward and share stories.

Contractors | May 24, 2023
The average U.S. contractor has 8.9 months worth of construction work in the pipeline, as of April 2023
Contractor backlogs climbed slightly in April, from a seven-month low the previous month, according to Associated Builders and Contractors.

Multifamily Housing | May 23, 2023
One out of three office buildings in largest U.S. cities are suitable for residential conversion
Roughly one in three office buildings in the largest U.S. cities are well suited to be converted to multifamily residential properties, according to a study by global real estate firm Avison Young. Some 6,206 buildings across 10 U.S. cities present viable opportunities for conversion to residential use.

Industry Research | May 22, 2023
2023 High Growth Study shares tips for finding success in uncertain times
Lee Frederiksen, Managing Partner, Hinge, reveals key takeaways from the firm's recent High Growth study.

Multifamily Housing | May 8, 2023
The average multifamily rent was $1,709 in April 2023, up for the second straight month
Despite economic headwinds, the multifamily housing market continues to demonstrate resilience, according to a new Yardi Matrix report.

Market Data | May 2, 2023
Nonresidential construction spending up 0.7% in March 2023 versus previous month
National nonresidential construction spending increased by 0.7% in March, according to an Associated Builders and Contractors analysis of data published today by the U.S. Census Bureau. On a seasonally adjusted annualized basis, nonresidential spending totaled $997.1 billion for the month.

Hotel Facilities | May 2, 2023
U.S. hotel construction up 9% in the first quarter of 2023, led by Marriott and Hilton
In the latest United States Construction Pipeline Trend Report from Lodging Econometrics (LE), analysts report that construction pipeline projects in the U.S. continue to increase, standing at 5,545 projects/658,207 rooms at the close of Q1 2023. Up 9% by both projects and rooms year-over-year (YOY); project totals at Q1 ‘23 are just 338 projects, or 5.7%, behind the all-time high of 5,883 projects recorded in Q2 2008.

Market Data | May 1, 2023
AEC firm proposal activity rebounds in the first quarter of 2023: PSMJ report
Proposal activity for architecture, engineering and construction (A/E/C) firms increased significantly in the 1st Quarter of 2023, according to PSMJ’s Quarterly Market Forecast (QMF) survey. The predictive measure of the industry’s health rebounded to a net plus/minus index (NPMI) of 32.8 in the first three months of the year.


