

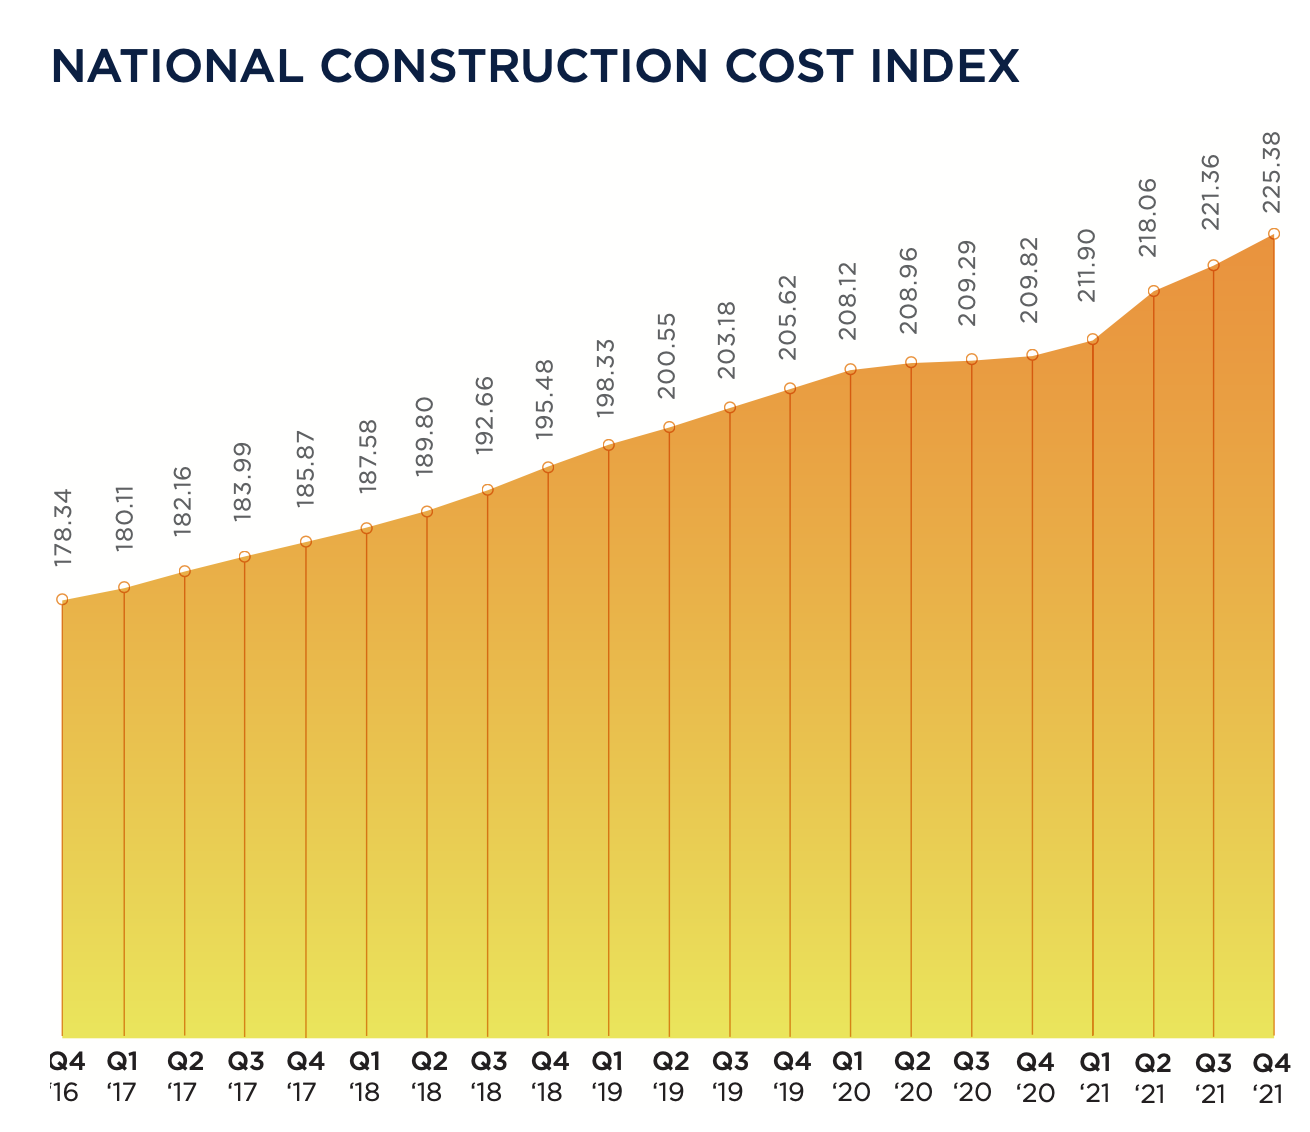
In the 12 months ended December 2021, bid construction costs rose 7.42 percent. “These increases are reminiscent of the sort of cost increases that we saw in the period 2004 to 2007,” wrote Julian Anderson, FRICS, President-North America for the construction advisory firm Rider Levett Bucknall (RLB), which today released its Fourth Quarter 2021 North America Construction Cost Report.
RLB’s National Construction Cost Index for the fourth quarter stood at 225.38, 7.4 percent higher than the Index for the fourth quarter of 2020, and 1.8 percent higher than last year’s third quarter. In his essay for this report, Anderson was optimistic about the eventual positive impact of the recently passed Bipartisan Infrastructure bill on construction and repair.
However, the force of that legislation could be stymied, or at least delayed, by supply chain problems that continue to plague the industry. Bottlenecks at western ports and chronic shortages of skilled labor still contribute to this volatility. Cost increases are also a function of rising inflation, as the Consumer Price Index registered a year-over-year increase of 5.38 percent.
On the positive side, America’s Gross Domestic Product, which measures output, returned to 2.1 percent, which was about where it was in the pre-pandemic fourth quarter of 2019. And the rate of unemployment for the construction sector dipped to 4.5 percent in Q421, versus 9.6 percent in Q420. Construction tracked national unemployment that has also been on a downward trend.
SEVERAL METROS BUCKED QUARTERLY COST TREND
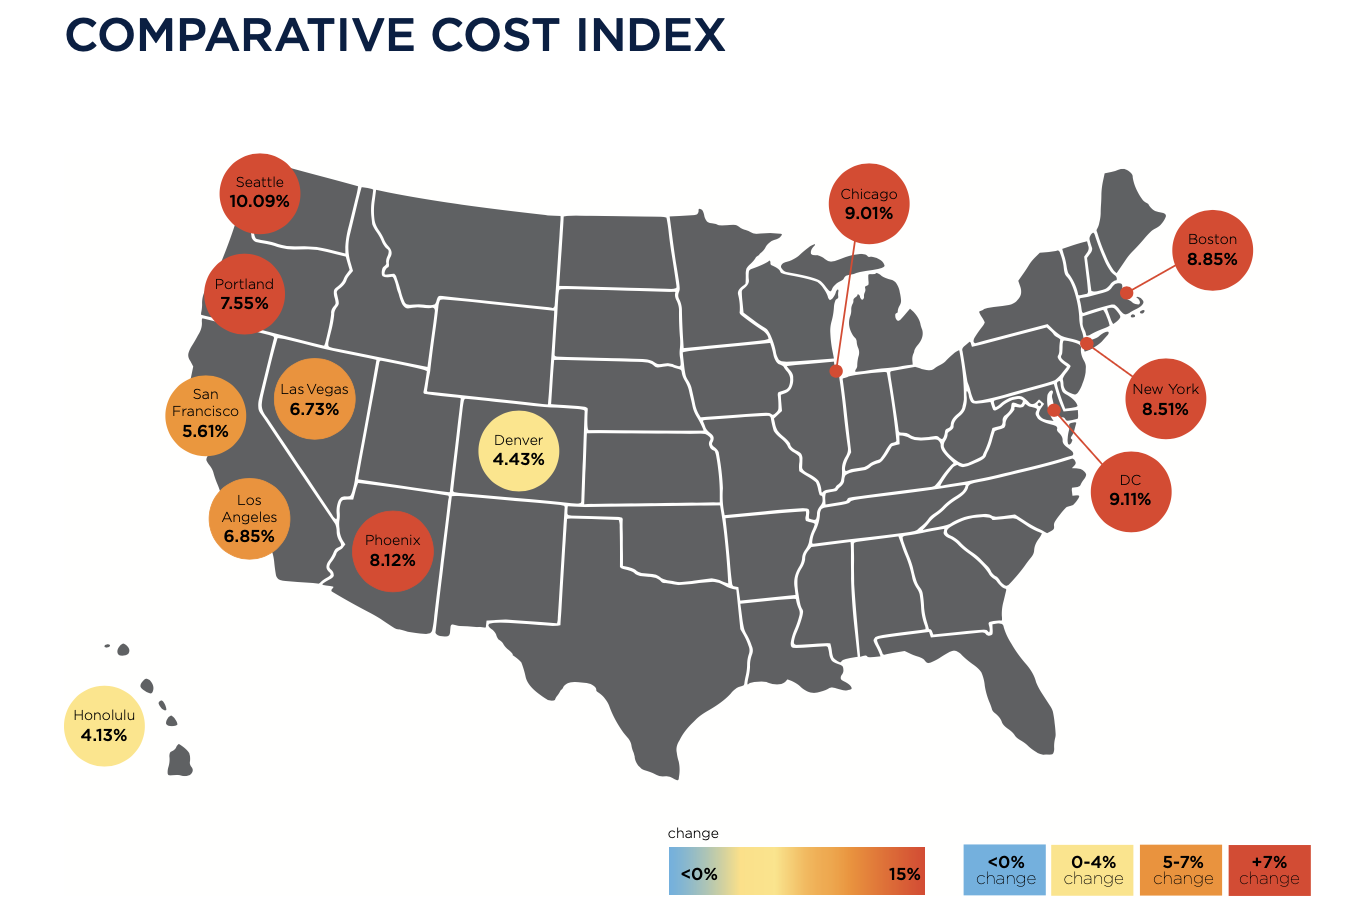
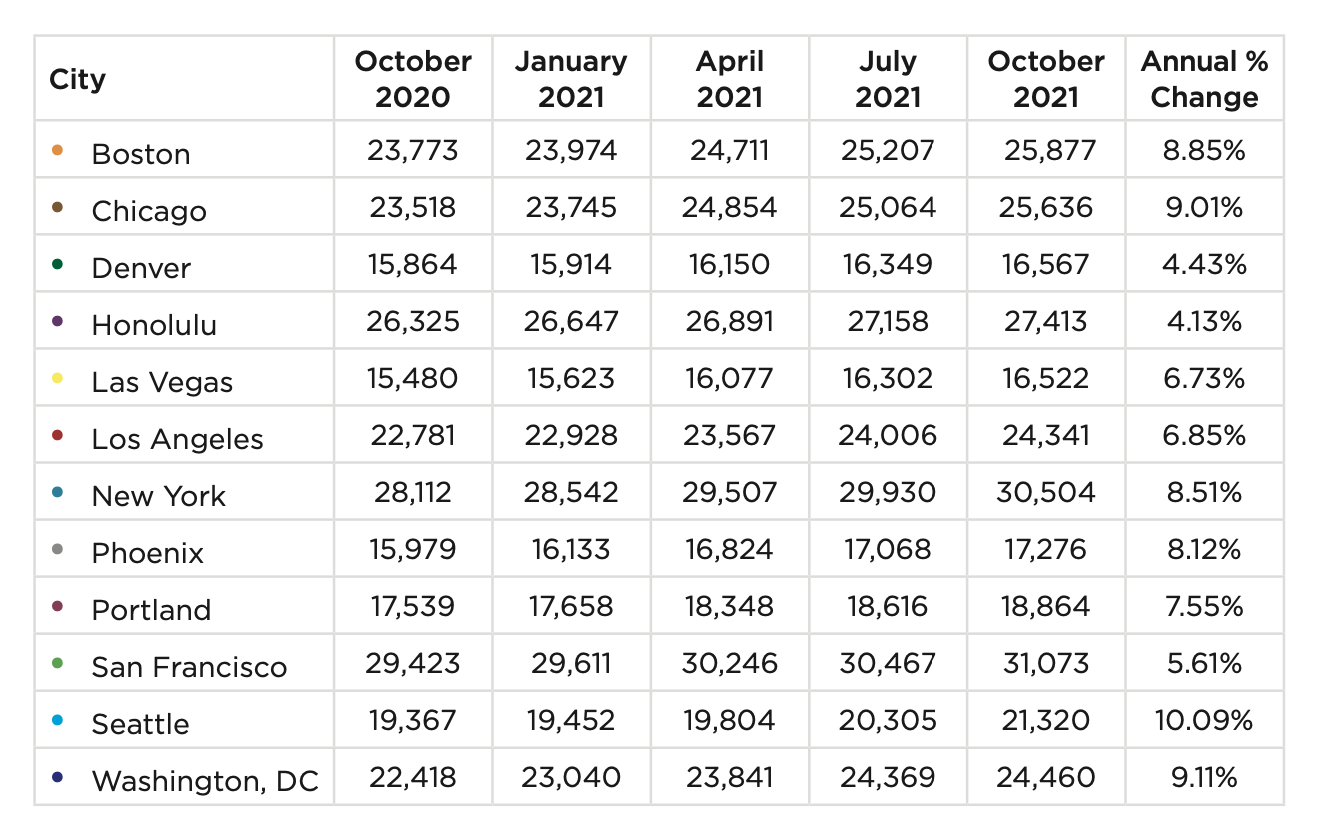
Nonresidential construction spending in November 2021, the latest month for which data were available from the Census Bureau, stood at $820.6 billion, 3.4 percent higher than the same month in 2021. But materials and labor keep getting more expensive, too. RLB’s Comparative Cost Index found that, from October 2020 through October 2021, construction costs rose by 10.09 percent in Seattle, by 9.11 percent in Washington DC, by 9.01 percent in Chicago, by 8.85 percent in Boston, and by 8.51 percent in New York.
Indexed by building type, construction costs were among the highest in New York for offices, shopping malls, hospitals, single-family homes, and high schools. San Francisco’s construction costs exceeded the other markets RLB tracked for five-star hotels, hospitals, warehouses, parking structures, multifamily homes, high schools, and universities.
Honolulu is the most expensive market in which to build elementary schools. But that market, along with Denver, Las Vegas, Los Angeles, Phoenix, Portland, and Washington DC, experienced overall cost increases between July 1 and October 1 that were less than the national average for that period, according to RLB estimates.
Related Stories

Industry Research | Jan 23, 2024
Leading economists forecast 4% growth in construction spending for nonresidential buildings in 2024
Spending on nonresidential buildings will see a modest 4% increase in 2024, after increasing by more than 20% last year according to The American Institute of Architects’ latest Consensus Construction Forecast. The pace will slow to just over 1% growth in 2025, a marked difference from the strong performance in 2023.

Construction Costs | Jan 22, 2024
Construction material prices continue to normalize despite ongoing challenges
Gordian’s most recent Quarterly Construction Cost Insights Report for Q4 2023 describes an industry still attempting to recover from the impact of COVID. This was complicated by inflation, weather, and geopolitical factors that resulted in widespread pricing adjustments throughout the construction materials industries.

Hotel Facilities | Jan 22, 2024
U.S. hotel construction is booming, with a record-high 5,964 projects in the pipeline
The hotel construction pipeline hit record project counts at Q4, with the addition of 260 projects and 21,287 rooms over last quarter, according to Lodging Econometrics.

Multifamily Housing | Jan 15, 2024
Multifamily rent growth rate unchanged at 0.3%
The National Multifamily Report by Yardi Matrix highlights the highs and lows of the multifamily market in 2023. Despite strong demand, rent growth remained unchanged at 0.3 percent.

Self-Storage Facilities | Jan 5, 2024
The state of self-storage in early 2024
As the housing market cools down, storage facilities suffer from lower occupancy and falling rates, according to the December 2023 Yardi Matrix National Self Storage Report.

Designers | Dec 25, 2023
Redefining the workplace is a central theme in Gensler’s latest Design Report
The firm identifies eight mega trends that mostly stress human connections.

Contractors | Dec 12, 2023
The average U.S. contractor has 8.5 months worth of construction work in the pipeline, as of November 2023
Associated Builders and Contractors reported today that its Construction Backlog Indicator inched up to 8.5 months in November from 8.4 months in October, according to an ABC member survey conducted Nov. 20 to Dec. 4. The reading is down 0.7 months from November 2022.

Market Data | Nov 27, 2023
Number of employees returning to the office varies significantly by city
While the return-to-the-office trend is felt across the country, the percentage of employees moving back to their offices varies significantly according to geography, according to Eptura’s Q3 Workplace Index.

Market Data | Nov 14, 2023
The average U.S. contractor has 8.4 months worth of construction work in the pipeline, as of September 2023
Associated Builders and Contractors reported that its Construction Backlog Indicator declined to 8.4 months in October from 9.0 months in September, according to an ABC member survey conducted from Oct. 19 to Nov. 2. The reading is down 0.4 months from October 2022. Backlog now stands at its lowest level since the first quarter of 2022.

Multifamily Housing | Nov 9, 2023
Multifamily project completions forecast to slow starting 2026
Yardi Matrix has released its Q4 2023 Multifamily Supply Forecast, emphasizing a short-term spike and plateau of new construction.


