


HomeUnion has released a list of the most and least affordable rental housing markets in the U.S. Chicago tops the list as the most affordable metro, while Oakland, Calif., is the most expensive rental market, based on rent-to-income ratios.
“With its low cost of living, relatively large housing inventory levels and high affordability, Chicago is an excellent market for residents entering the renting pool,” says Steve Hovland, Director of Research for HomeUnion. It’s is the only metro in the country where typical renters spend less than 20% of their annual income on housing. Emerging neighborhoods like Logan Square and other West Side locations have become increasingly popular areas for young professionals, making Chicago an excellent choice for millennials.
The second location on HomeUnion’s list – Charlotte, N.C. – also has a low cost of living and high affordability, with average annual rents of under $16,000. “About one-quarter of the average income of a typical Charlotte resident goes to rental housing, making it appealing to millennials as well,” says Hovland.
Here’s a list of the 10 most affordable rental markets in the nation:
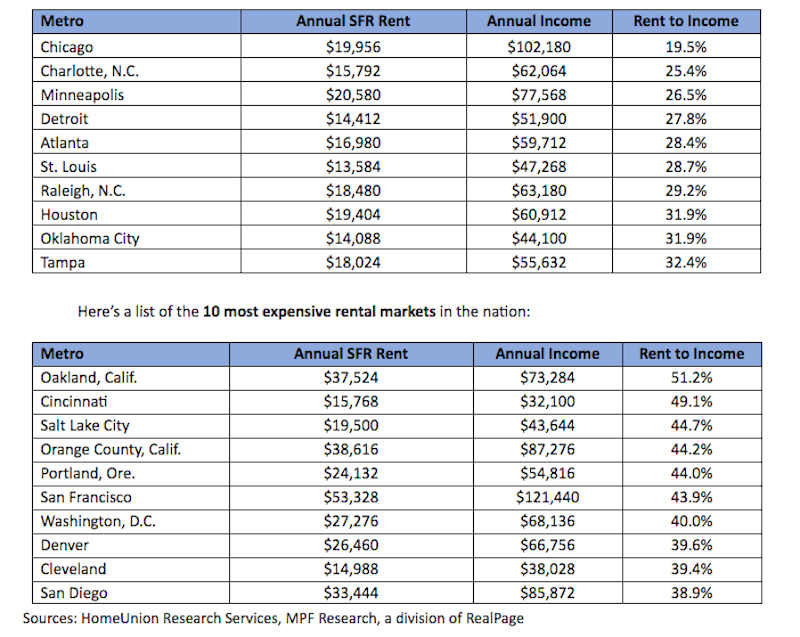
“Low affordability negatively impacts all renters in the Bay Area, Denver, Southern California and Washington, D.C., because of strong local job market conditions, intense demand for rental properties, and high mortgage costs for owner-occupied housing,” Hovland says.
Established and mature markets, such as Cincinnati and Cleveland, where home prices remain affordable, negatively impact renters’ wallets. “A significant number of potential young renters are migrating out of Ohio to Chicago or booming western metros such as Denver, the Bay Area and Los Angeles, leaving mostly low-wage earners to occupy rentals,” Hovland concludes.
Related Stories

Hotel Facilities | Jul 28, 2022
As travel returns, U.S. hotel construction pipeline growth follows
According to the recently released United States Construction Pipeline Trend Report from Lodging Econometrics (LE), the total U.S. construction pipeline stands at 5,220 projects/621,268 rooms at the close of 2022’s second quarter, up 9% Year-Over-Year (YOY) by projects and 4% YOY by rooms.

Codes and Standards | Jul 22, 2022
Hurricane-resistant construction may be greatly undervalued
New research led by an MIT graduate student at the school’s Concrete Sustainability Hub suggests that the value of buildings constructed to resist wind damage in hurricanes may be significantly underestimated.

Market Data | Jul 21, 2022
Architecture Billings Index continues to stabilize but remains healthy
Architecture firms reported increasing demand for design services in June, according to a new report today from The American Institute of Architects (AIA).

Market Data | Jul 21, 2022
Despite deteriorating economic conditions, nonresidential construction spending projected to increase through 2023
Construction spending on buildings is projected to increase just over nine percent this year and another six percent in 2023, according to a new report from the American Institute of Architects (AIA).

Building Team | Jul 18, 2022
Understanding the growing design-build market
FMI’s new analysis of the design-build market forecast for the next fives years shows that this delivery method will continue to grow, despite challenges from the COVID-19 pandemic.

Market Data | Jul 1, 2022
Nonresidential construction spending slightly dips in May, says ABC
National nonresidential construction spending was down by 0.6% in May, according to an Associated Builders and Contractors analysis of data published today by the U.S. Census Bureau.

Market Data | Jun 30, 2022
Yardi Matrix releases new national rent growth forecast
Rents in most American cities continue to rise slightly each month, but are not duplicating the rapid escalation rates exhibited in 2021.

Market Data | Jun 22, 2022
Architecture Billings Index slows but remains strong
Architecture firms reported increasing demand for design services in May, according to a new report today from The American Institute of Architects (AIA).

Building Team | Jun 17, 2022
Data analytics in design and construction: from confusion to clarity and the data-driven future
Data helps virtual design and construction (VDC) teams predict project risks and navigate change, which is especially vital in today’s fluctuating construction environment.

Market Data | Jun 15, 2022
ABC’s construction backlog rises in May; contractor confidence falters
Associated Builders and Contractors reports today that its Construction Backlog Indicator increased to nine months in May from 8.8 months in April, according to an ABC member survey conducted May 17 to June 3. The reading is up one month from May 2021.


