


Grumman|Butkus Associates, a firm of energy efficiency consultants and sustainable design engineers, recently released the results of its 2020 Hospital Energy and Water Benchmarking Survey, focusing on healthcare facilities’ resource usage trends and costs for calendar year 2019.
Since GBA initiated the survey more than 25 years ago, hospitals’ overall fossil fuel use has trended downward, but electricity use isn’t declining as much. The average combined Btu/ft2 (electricity plus gas/steam) for participating facilities was 233,491 in this year’s survey, down from 245,258 in CY2018. However, interpretation of year-to-year trends should be tempered by the realization that the respondent pool for the 2020 survey was smaller than, and different from, the pool from 2019, due to the stresses that COVID-19 response placed on the healthcare facility personnel who normally participate.
Square-foot prices for gas/steam fell ($0.67 in 2919, compared with $0.74 in 2018), and square-foot prices for electricity were also down ($2.32 in 2019, compared with $2.41 in 2017). The overall result is that total reported ft2 costs for energy (gas/steam plus electric) decreased: $2.99 for 2019, compared with $3.31 for 2018.
Hospitals’ average carbon footprint has remained fairly steady at 50 to 60 pounds of CO2 equivalent per ft2 per year since GBA began calculating carbon data in 1999. “If we are going to address the very daunting issue of climate change, the healthcare industry must make greater strides in reducing its carbon footprint,” says Dan Doyle, GBA Chairman. “President Biden has proposed cutting greenhouse gas emissions by 50 to 52% by 2030 (from a 2005 baseline) and creating a net-zero-carbon economy by 2050. Hospitals have been making slow, steady progress to improve their energy efficiency, but the change has not been rapid enough.”
Participating facilities displayed a broad range of usage patterns. For instance, a few of this year’s survey participants reported fossil fuel consumption of more than 200,000 Btu/sf/year, compared with the general mid-range of facilities (about 130,000 Btu/sf/year) and those that used least (75,000 Btu/sf/year or less). These variations can be related to unique aspects of a site, and/or local variations in energy costs. Thus, our respondents’ fossil fuel energy costs may exceed $1.50/sf/year or come in at less than $0.50/sf/year.
Similarly, several hospitals reported consuming more than 40 kWh/sf/year in electrical energy, compared with a mid-range of about 27 kWh/sf/year. A few survey participants squeaked in at less than 15 kWh/sf/year. The wide differences in usage mean that some of our participants are paying well over $4/sf/year for electrical energy, while many are getting by at less than $2.50 and a few at less than $1.50.
“Facilities that have high unit costs for energy should view this as an opportunity,” says Doyle. “For example, an energy conservation project that would have a five-year payback at an ‘average’ facility may have a payback of just 2.5 or 3 years at a facility with higher unit costs for energy.”
He adds, "To meet the ambitious goals recently put forth by the Biden administration, hospitals will have to achieve much more significant reductions in the near term. These reductions can only be achieved by implementing larger and more costly retrofits of existing buildings. The drive to de-carbonize will also require building owners to embrace fuel switching, to renewable-based energy sources. Many leading healthcare systems are implementing on-site renewables (usually solar photovoltaic systems), as well as off-site renewables, often funded through Power Purchase Agreements (PPA), to purchase some or all of their electricity."
Hospital water/sewer use is also gradually declining, averaging about 41 gallons per square foot per year in CY2019 (compared with more than 60 gallons/ ft2/year a decade ago). Costs for water/sewer are generally rising, however. (The 2019 data reported by respondents, with an average annual water/sewer cost of $0.34 /ft2, represents a significant drop from 2018 but is likely a COVID-19 related reporting anomaly.)
“GBA expects the trend of rising water and sewer costs to continue,” says Doyle. “Price hikes not only reflect increasing costs to extract and treat the water, but also the fact that cash-strapped governmental entities may view water as a revenue source. Costs to upgrade or replace aging infrastructure are also contributing to escalating costs.”
Since 1995, the GBA survey has provided a free annual benchmarking resource. Hospitals are invited to participate by submitting responses to a short list of questions. Information for this edition was provided by 79 hospitals located in Illinois (33), Wisconsin (19), Michigan (12), Texas (5), and numerous other states coast-to-coast.
Full results and analysis, as well as information about participating in the 2021 survey (2020 data), are available at the firm’s website: grummanbutkus.com/HES. The 2020 data is important; it will be based on different operating conditions than in previous years. Respondents’ 2020 data will improve overall understanding of the pandemic's impact on hospital energy and water use, and increase knowledge within the healthcare community.
Related Stories

Market Data | Jun 20, 2018
7% year-over-year growth in the global construction pipeline
There are 5,952 projects/1,115,288 rooms under construction, up 8% by projects YOY.
Market Data | Jun 19, 2018
ABC’s Construction Backlog Indicator remains elevated in first quarter of 2018
The CBI shows highlights by region, industry, and company size.
Market Data | Jun 19, 2018
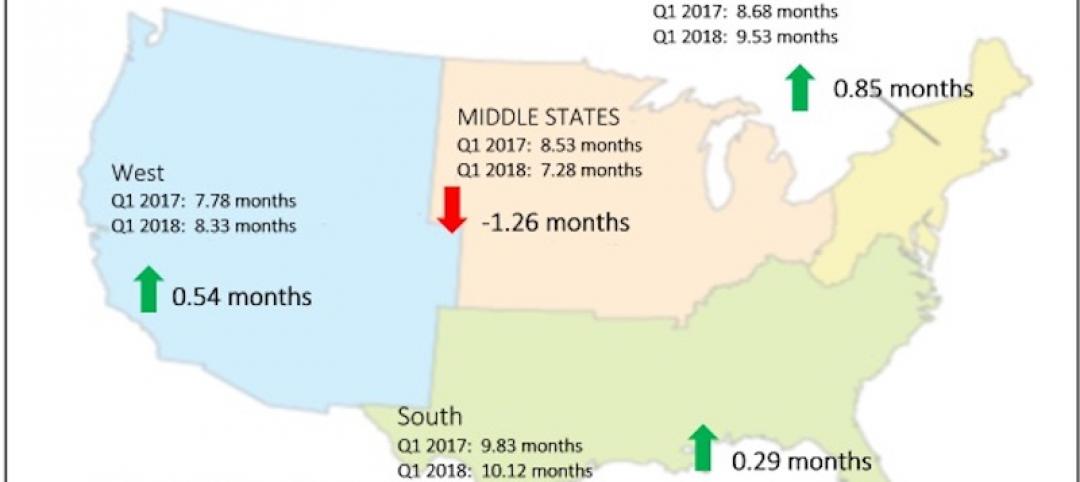
America’s housing market still falls short of providing affordable shelter to many
The latest report from the Joint Center for Housing Studies laments the paucity of subsidies to relieve cost burdens of ownership and renting.

Market Data | Jun 18, 2018
AI is the path to maximum profitability for retail and FMCG firms
Leading retailers including Amazon, Alibaba, Lowe’s and Tesco are developing their own AI solutions for automation, analytics and robotics use cases.

Market Data | Jun 12, 2018
Yardi Matrix report details industrial sector's strength
E-commerce and biopharmaceutical companies seeking space stoke record performances across key indicators.
Market Data | Jun 8, 2018
Dodge Momentum Index inches up in May
May’s gain was the result of a 4.7% increase by the commercial component of the Momentum Index.
Market Data | Jun 4, 2018
Nonresidential construction remains unchanged in April
Private sector spending increased 0.8% on a monthly basis and is up 5.3% from a year ago.
Market Data | May 30, 2018
Construction employment increases in 256 metro areas between April 2017 & 2018
Dallas-Plano-Irving and Midland, Texas experience largest year-over-year gains; St. Louis, Mo.-Ill. and Bloomington, Ill. have biggest annual declines in construction employment amid continuing demand.

Market Data | May 29, 2018
America’s fastest-growing cities: San Antonio, Phoenix lead population growth
San Antonio added 24,208 people between July 2016 and July 2017, according to U.S. Census Bureau data.

Market Data | May 25, 2018
Construction group uses mobile technology to make highway work zones safer
Mobile advertising campaign urges drivers who routinely pass through certain work zones to slow down and be alert as new data shows motorists are more likely to be injured than construction workers.


